Welcome to DU!
The truly grassroots left-of-center political community where regular people, not algorithms, drive the discussions and set the standards.
Join the community:
Create a free account
Support DU (and get rid of ads!):
Become a Star Member
Latest Breaking News
General Discussion
The DU Lounge
All Forums
Issue Forums
Culture Forums
Alliance Forums
Region Forums
Support Forums
Help & Search
OKIsItJustMe
OKIsItJustMe's Journal
OKIsItJustMe's Journal
September 28, 2023
The Department of Energy Organization Act of 1977
https://www.energy.gov/sites/prod/files/2017/10/f38/DOE%20Organization%20Act%20in%20U.S.C..pdf…
§7111. Congressional findings
§7112. Congressional declaration of purpose
§7111. Congressional findings
The Congress of the United States finds that—(Pub. L. 95–91, title I, §101, Aug. 4, 1977, 91 Stat. 567.)
- the United States faces an increasing shortage of nonrenewable energy resources;
- this energy shortage and our increasing dependence on foreign energy supplies present a serious threat to the national security of the United States and to the health, safety and welfare of its citizens;
- a strong national energy program is needed to meet the present and future energy needs of the Nation consistent with overall national economic, environmental and social goals;
- responsibility for energy policy, regulation, and research, development and demonstration is fragmented in many departments and agencies and thus does not allow for the comprehensive, centralized focus necessary for effective coordination of energy supply and conservation programs; and
- formulation and implementation of a national energy program require the integration of major Federal energy functions into a single department in the executive branch.
§7112. Congressional declaration of purpose
The Congress therefore declares that the establishment of a Department of Energy is in the public interest and will promote the general welfare by assuring coordinated and effective administration of Federal energy policy and programs. It is the purpose of this chapter:(Pub. L. 95–91, title I, §102, Aug. 4, 1977, 91 Stat. 567; Pub. L. 101–510, div. C, title XXXI, §3163, Nov. 5, 1990, 104 Stat. 1841.)
- To establish a Department of Energy in the executive branch.
- To achieve, through the Department, effective management of energy functions of the Federal Government, including consultation with the heads of other Federal departments and agencies in order to encourage them to establish and observe policies consistent with a coordinated energy policy, and to promote maximum possible energy conservation measures in connection with the activities within their respective jurisdictions.
- To provide for a mechanism through which a coordinated national energy policy can be formulated and implemented to deal with the short-, mid- and long-term energy problems of the Nation; and to develop plans and programs for dealing with domestic energy production and import shortages.
- To create and implement a comprehensive energy conservation strategy that will receive the highest priority in the national energy program.
- To carry out the planning, coordination, support, and management of a balanced and comprehensive energy research and development program, including—
- assessing the requirements for energy research and development;
- developing priorities necessary to meet those requirements;
- undertaking programs for the optimal development of the various forms of energy production and conservation; and
- disseminating information resulting from such programs, including disseminating information on the commercial feasibility and use of energy from fossil, nuclear, solar, geothermal, and other energy technologies.
- To place major emphasis on the development and commercial use of solar, geothermal, recycling and other technologies utilizing renewable energy resources.
- To continue and improve the effectiveness and objectivity of a central energy data collection and analysis program within the Department.
- To facilitate establishment of an effective strategy for distributing and allocating fuels in periods of short supply and to provide for the administration of a national energy supply reserve.
- To promote the interests of consumers through the provision of an adequate and reliable supply of energy at the lowest reasonable cost.
- To establish and implement through the Department, in coordination with the Secretaries of State, Treasury, and Defense, policies regarding international energy issues that have a direct impact on research, development, utilization, supply, and conservation of energy in the United States and to undertake activities involving the integration of domestic and foreign policy relating to energy, including provision of independent technical advice to the President on international negotiations involving energy resources, energy technologies, or nuclear weapons issues, except that the Secretary of State shall continue to exercise primary authority for the conduct of foreign policy relating to energy and nuclear nonproliferation, pursuant to policy guidelines established by the President.
- To provide for the cooperation of Federal, State, and local governments in the development and implementation of national energy policies and programs.
- To foster and assure competition among parties engaged in the supply of energy and fuels.
- To assure incorporation of national environmental protection goals in the formulation and implementation of energy programs, and to advance the goals of restoring, protecting, and enhancing environmental quality, and assuring public health and safety.
- To assure, to the maximum extent practicable, that the productive capacity of private enterprise shall be utilized in the development and achievement of the policies and purposes of this chapter.
- To provide for, encourage, and assist public participation in the development and enforcement of national energy programs.
- To create an awareness of, and responsibility for, the fuel and energy needs of rural and urban residents as such needs pertain to home heating and cooling, transportation, agricultural production, electrical generation, conservation, and research and development.
- To foster insofar as possible the continued good health of the Nation's small business firms, public utility districts, municipal utilities, and private cooperatives involved in energy production, transportation, research, development, demonstration, marketing, and merchandising.
- To provide for the administration of the functions of the Energy Research and Development Administration related to nuclear weapons and national security which are transferred to the Department by this chapter.
- To ensure that the Department can continue current support of mathematics, science, and engineering education programs by using the personnel, facilities, equipment, and resources of its laboratories and by working with State and local education agencies, institutions of higher education, and business and industry. The Department's involvement in mathematics, science, and engineering education should be consistent with its main mission and should be coordinated with all Federal efforts in mathematics, science, and engineering education, especially with the Department of Education and the National Science Foundation (which have the primary Federal responsibility for mathematics, science, and engineering education).
…
August 21, 2023
NREL: 100% Clean Electricity by 2035 Study
(Please note. This is a publication by The National Renewable Energy Laboratory - NREL. Copyright concerns are nil.)
This is the goal. No major technological breakthroughs are required, just commitment and a lot of work. Four paths are explored. Pick your favorite, or a combination.
https://www.nrel.gov/analysis/100-percent-clean-electricity-by-2035-study.html
100% Clean Electricity by 2035 Study
An NREL study shows there are multiple pathways to 100% clean electricity by 2035 that would produce significant benefits exceeding the additional power system costs.
For the study, funded by the U.S. Department of Energy’s Office of Energy Efficiency and Renewable Energy, NREL modeled technology deployment, costs, benefits, and challenges to decarbonize the U.S. power sector by 2035, evaluating a range of future scenarios to achieve a net-zero power grid by 2035.
The exact technology mix and costs will be determined by research and development, among other factors, over the next decade. The results are published in Examining Supply-Side Options To Achieve 100% Clean Electricity by 2035.
Scenario Approach
To examine what it would take to achieve a net-zero U.S. power grid by 2035, NREL leveraged decades of research on high-renewable power systems, from the Renewable Electricity Futures Study, to the Storage Futures Study, to the Los Angeles 100% Renewable Energy Study, to the Electrification Futures Study, and more.
NREL used its publicly available flagship Regional Energy Deployment System capacity expansion model to study supply-side scenarios representing a range of possible pathways to a net-zero power grid by 2035—from the most to the least optimistic availability and costs of technologies.
The scenarios apply a carbon constraint to:
Key Findings
Technology Deployment Must Rapidly Scale Up
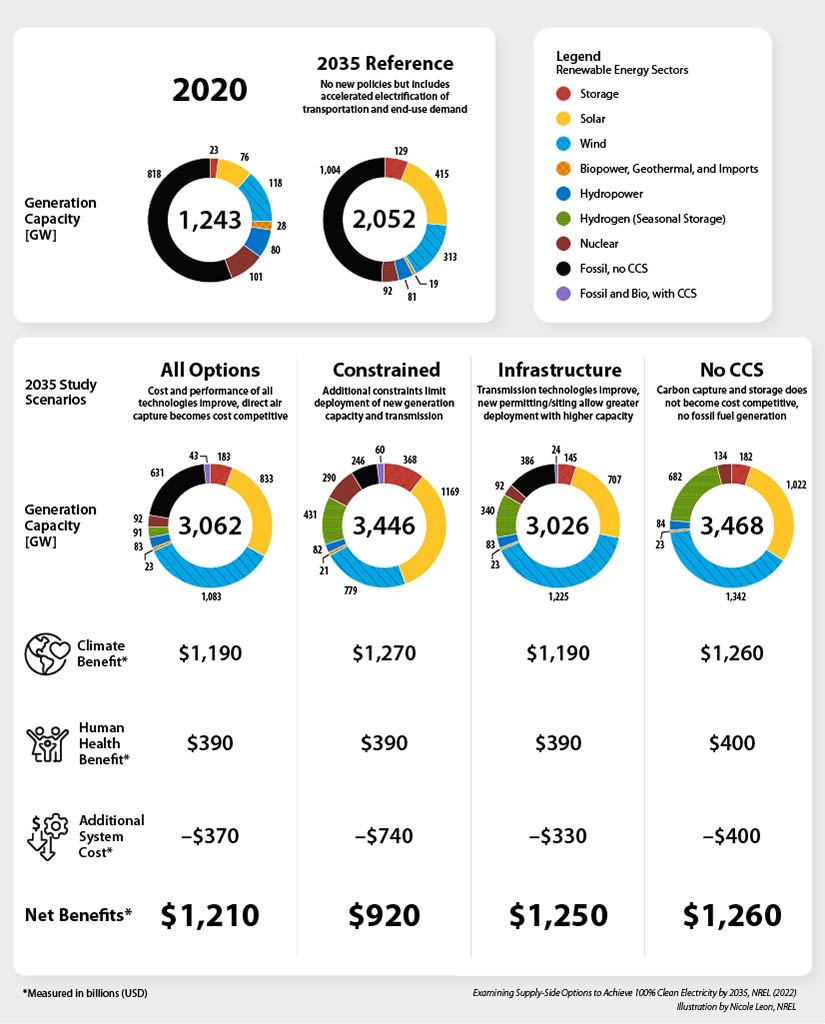
In all modeled scenarios, new clean energy technologies are deployed at an unprecedented scale and rate to achieve 100% clean electricity by 2035. As modeled, wind and solar energy provide 60%–80% of generation in the least-cost electricity mix in 2035, and the overall generation capacity grows to roughly three times the 2020 level by 2035—including a combined 2 terawatts of wind and solar.
To achieve those levels would require rapid and sustained growth in installations of solar and wind generation capacity. If there are challenges with siting and land use to be able to deploy this new generation capacity and associated transmission, nuclear capacity helps make up the difference and more than doubles today’s installed capacity by 2035.
Across the four scenarios, 5–8 gigawatts of new hydropower and 3–5 gigawatts of new geothermal capacity are also deployed by 2035. Diurnal storage (2–12 hours of capacity) also increases across all scenarios, with 120–350 gigawatts deployed by 2035 to ensure demand for electricity is met during all hours of the year.
Seasonal storage becomes important when clean electricity makes up about 80%–95% of generation and there is a multiday to seasonal mismatch of variable renewable supply and demand. Across the scenarios, seasonal capacity in 2035 ranges about 100–680 gigawatts.
Significant additional research is needed to understand the manufacturing and supply chain associated with the unprecedent deployment envisioned in the scenarios.
Download Infographic. (PDF) View Data.
Significant Additional Transmission Capacity
In all scenarios, significant transmission is also added in many locations, mostly to deliver energy from wind-rich regions to major load centers in the eastern United States. As modeled, the total transmission capacity in 2035 is one to almost three times today’s capacity, which would require between 1,400 and 10,100 miles of new high-capacity lines per year, assuming new construction starts in 2026.
Climate and Health Benefits of Decarbonization Offset the Costs
NREL finds in all modeled scenarios the health and climate benefits associated with fewer emissions offset the power system costs to get to 100% clean electricity.
Decarbonizing the power grid by 2035 could total $330 billion to $740 billion in additional power system costs, depending on restrictions on new transmission and other infrastructure development. However, there is substantial reduction in petroleum use in transportation and natural gas in buildings and industry by 2035. As a result, up to 130,000 premature deaths are avoided by 2035, which could save between $390 billion to $400 billion in avoided mortality costs.
When factoring in the avoided cost of damage from floods, drought, wildfires, and hurricanes due to climate change, the United States could save over an additional $1.2 trillion—totaling an overall net benefit to society ranging from $920 billion to $1.2 trillion.
Necessary Actions To Achieve 100% Clean Electricity
The transition to a 100% clean electricity U.S. power system will require more than reduced technology costs. Several key actions will need to take place in the coming decade:
Failing to achieve any of the key actions could increase the difficulty of realizing the scenarios outlined in the study.
…
An NREL study shows there are multiple pathways to 100% clean electricity by 2035 that would produce significant benefits exceeding the additional power system costs.
For the study, funded by the U.S. Department of Energy’s Office of Energy Efficiency and Renewable Energy, NREL modeled technology deployment, costs, benefits, and challenges to decarbonize the U.S. power sector by 2035, evaluating a range of future scenarios to achieve a net-zero power grid by 2035.
The exact technology mix and costs will be determined by research and development, among other factors, over the next decade. The results are published in Examining Supply-Side Options To Achieve 100% Clean Electricity by 2035.
Scenario Approach
To examine what it would take to achieve a net-zero U.S. power grid by 2035, NREL leveraged decades of research on high-renewable power systems, from the Renewable Electricity Futures Study, to the Storage Futures Study, to the Los Angeles 100% Renewable Energy Study, to the Electrification Futures Study, and more.
NREL used its publicly available flagship Regional Energy Deployment System capacity expansion model to study supply-side scenarios representing a range of possible pathways to a net-zero power grid by 2035—from the most to the least optimistic availability and costs of technologies.
The scenarios apply a carbon constraint to:
- Achieve 100% clean electricity by 2035 under accelerated demand electrification
- Reduce economywide, energy-related emissions by 62% in 2035 relative to 2005 levels—a steppingstone to economywide decarbonization by 2050.
Key Findings
Technology Deployment Must Rapidly Scale Up
In all modeled scenarios, new clean energy technologies are deployed at an unprecedented scale and rate to achieve 100% clean electricity by 2035. As modeled, wind and solar energy provide 60%–80% of generation in the least-cost electricity mix in 2035, and the overall generation capacity grows to roughly three times the 2020 level by 2035—including a combined 2 terawatts of wind and solar.
To achieve those levels would require rapid and sustained growth in installations of solar and wind generation capacity. If there are challenges with siting and land use to be able to deploy this new generation capacity and associated transmission, nuclear capacity helps make up the difference and more than doubles today’s installed capacity by 2035.
Across the four scenarios, 5–8 gigawatts of new hydropower and 3–5 gigawatts of new geothermal capacity are also deployed by 2035. Diurnal storage (2–12 hours of capacity) also increases across all scenarios, with 120–350 gigawatts deployed by 2035 to ensure demand for electricity is met during all hours of the year.
Seasonal storage becomes important when clean electricity makes up about 80%–95% of generation and there is a multiday to seasonal mismatch of variable renewable supply and demand. Across the scenarios, seasonal capacity in 2035 ranges about 100–680 gigawatts.
Significant additional research is needed to understand the manufacturing and supply chain associated with the unprecedent deployment envisioned in the scenarios.
Download Infographic. (PDF) View Data.
Significant Additional Transmission Capacity
In all scenarios, significant transmission is also added in many locations, mostly to deliver energy from wind-rich regions to major load centers in the eastern United States. As modeled, the total transmission capacity in 2035 is one to almost three times today’s capacity, which would require between 1,400 and 10,100 miles of new high-capacity lines per year, assuming new construction starts in 2026.
Climate and Health Benefits of Decarbonization Offset the Costs
NREL finds in all modeled scenarios the health and climate benefits associated with fewer emissions offset the power system costs to get to 100% clean electricity.
Decarbonizing the power grid by 2035 could total $330 billion to $740 billion in additional power system costs, depending on restrictions on new transmission and other infrastructure development. However, there is substantial reduction in petroleum use in transportation and natural gas in buildings and industry by 2035. As a result, up to 130,000 premature deaths are avoided by 2035, which could save between $390 billion to $400 billion in avoided mortality costs.
When factoring in the avoided cost of damage from floods, drought, wildfires, and hurricanes due to climate change, the United States could save over an additional $1.2 trillion—totaling an overall net benefit to society ranging from $920 billion to $1.2 trillion.
Necessary Actions To Achieve 100% Clean Electricity
The transition to a 100% clean electricity U.S. power system will require more than reduced technology costs. Several key actions will need to take place in the coming decade:
- Dramatic acceleration of electrification and increased efficiency in demand
- New energy infrastructure installed rapidly throughout the country
- Expanded clean technology manufacturing and the supply chain
- Continued research, development, demonstration, and deployment to bring emerging technologies to the market.
Failing to achieve any of the key actions could increase the difficulty of realizing the scenarios outlined in the study.
…
July 4, 2019
Map of countries by fertility rate (2018), according to CIA World Factbook
Yet, the US is the primary source of carbon dioxide emissions:
Countries by carbon dioxide emissions in thousands of tonnes per annum, via the burning of fossil fuels (blue the highest and green the lowest).
The reason is our very high per capita CO₂ emissions:

Birth rates clearly are not the cause of "climate change."
By harping about "birth control," US citizens can blame Africans for "climate change" because their birth rate is so high. If our per capita CO₂ emissions matched Africa’s, we wouldn’t be in this predicament.
That’s why I have decided the meme is racist in nature.
It’s also a convenient excuse not to do something difficult, like cutting our per capita emissions. After all, such efforts are useless if those Africans are going to keep breeding? (Right?)
I have decided that the "birth control"/"climate change" meme is racist
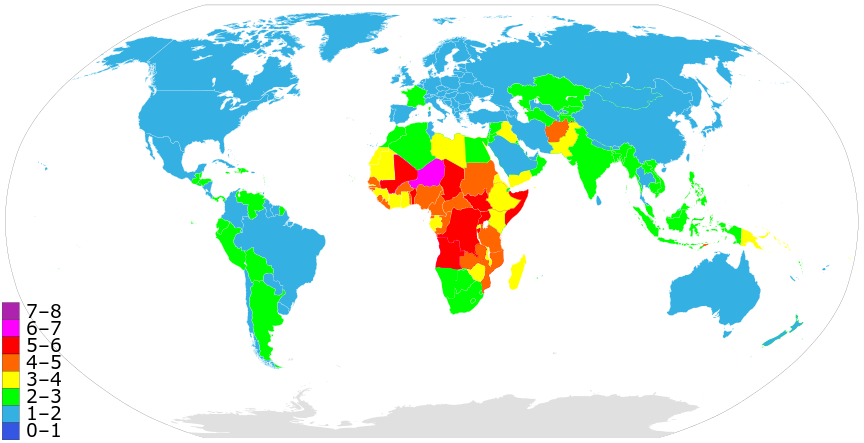
The US has a relatively low total fertility rate (births per woman) compared to Africa:
Map of countries by fertility rate (2018), according to CIA World Factbook
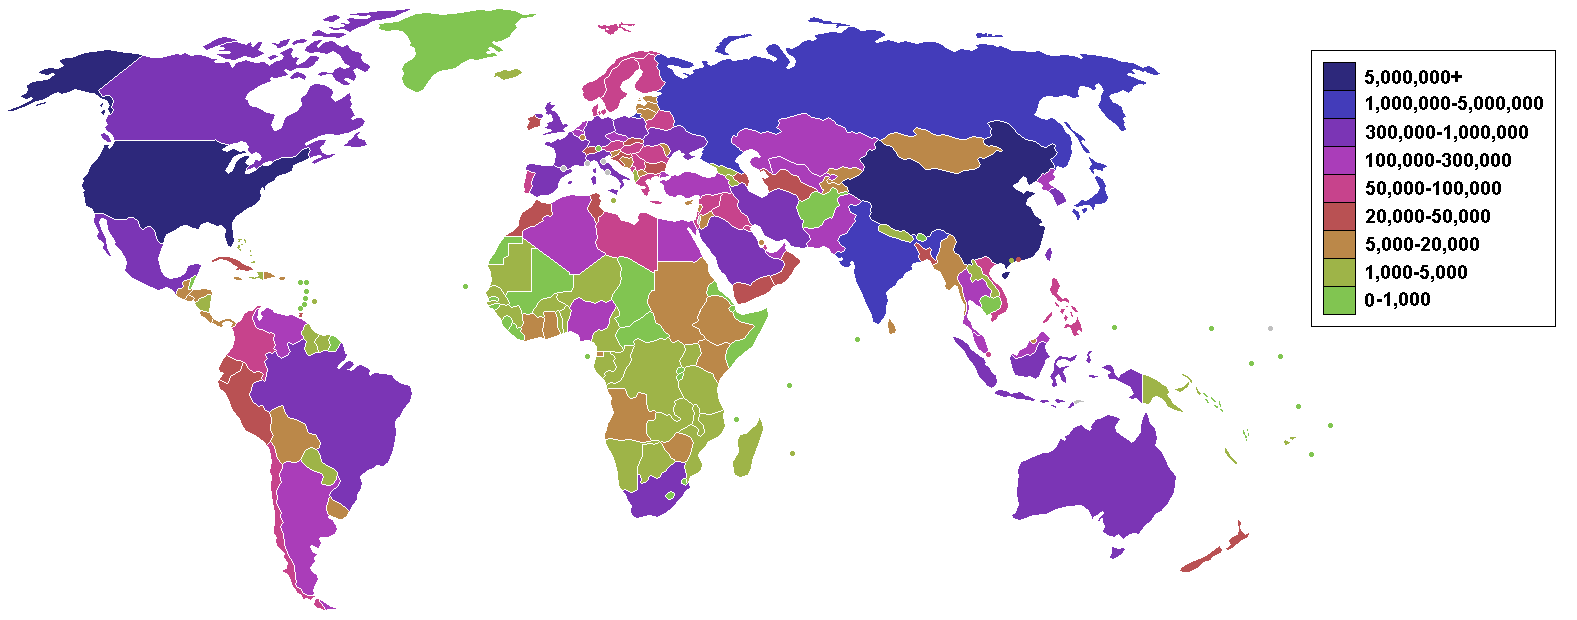
Yet, the US is the primary source of carbon dioxide emissions:
Countries by carbon dioxide emissions in thousands of tonnes per annum, via the burning of fossil fuels (blue the highest and green the lowest).
The reason is our very high per capita CO₂ emissions:
Birth rates clearly are not the cause of "climate change."
By harping about "birth control," US citizens can blame Africans for "climate change" because their birth rate is so high. If our per capita CO₂ emissions matched Africa’s, we wouldn’t be in this predicament.
That’s why I have decided the meme is racist in nature.
It’s also a convenient excuse not to do something difficult, like cutting our per capita emissions. After all, such efforts are useless if those Africans are going to keep breeding? (Right?)
May 24, 2019
New Studies Increase Confidence in NASA's Measure of Earth's Temperature
(Please note: Story from NASA — copyright concerns are nil.)
https://climate.nasa.gov/news/2876/
Features | May 23, 2019
New Studies Increase Confidence in NASA's Measure of Earth's Temperature
By Jessica Merzdorf,
NASA's Goddard Space Flight Center
A new assessment of NASA's record of global temperatures revealed that the agency's estimate of Earth's long-term temperature rise in recent decades is accurate to within less than a tenth of a degree Fahrenheit, providing confidence that past and future research is correctly capturing rising surface temperatures.
The most complete assessment ever of statistical uncertainty within the GISS Surface Temperature Analysis (GISTEMP) data product shows that the annual values are likely accurate to within 0.09 degrees Fahrenheit (0.05 degrees Celsius) in recent decades, and 0.27 degrees Fahrenheit (0.15 degrees C) at the beginning of the nearly 140-year record.
This data record, maintained by NASA’s Goddard Institute for Space Studies (GISS) in New York City, is one of a handful kept by major science institutions around the world that track Earth's temperature and how it has risen in recent decades. This global temperature record has provided one of the most direct benchmarks of how our home planet's climate has changed as greenhouse gas concentrations rise.
The study also confirms what researchers have been saying for some time now: that Earth's global temperature increase since 1880 – about 2 degrees Fahrenheit, or a little more than 1 degree Celsius – cannot be explained by any uncertainty or error in the data. Going forward, this assessment will give scientists the tools to explain their results with greater confidence.
GISTEMP is a widely used index of global mean surface temperature anomaly — it shows how much warmer or cooler than normal Earth’s surface is in a given year. "Normal" is defined as the average during a baseline period of 1951-80.
NASA uses GISTEMP in its annual global temperature update, in partnership with the National Oceanic and Atmospheric Administration. (In 2019, NASA and NOAA found that 2018 was the fourth-warmest year on record, with 2016 holding the top spot.) The index includes land and sea surface temperature data back to 1880, and today incorporates measurements from 6,300 weather stations, research stations, ships and buoys around the world.
Previously, GISTEMP provided an estimate of uncertainty accounting for the spatial gaps between weather stations. Like other surface temperature records, GISTEMP estimates the temperatures between weather stations using data from the closest stations, a process called interpolation. Quantifying the statistical uncertainty present in those estimates helped researchers to be confident that the interpolation was accurate.
“Uncertainty is important to understand because we know that in the real world we don’t know everything perfectly,” said Gavin Schmidt, director of GISS and a co-author on the study. “All science is based on knowing the limitations of the numbers that you come up with, and those uncertainties can determine whether what you’re seeing is a shift or a change that is actually important.”
The study found that individual and systematic changes in measuring temperature over time were the most significant source of uncertainty. Also contributing was the degree of weather station coverage. Data interpolation between stations contributed some uncertainty, as did the process of standardizing data that was collected with different methods at different points in history.
After adding these components together, GISTEMP’s uncertainty value in recent years was still less than a tenth of a degree Fahrenheit, which is “very small,” Schmidt said.
The team used the updated model to reaffirm that 2016 was very probably the warmest year in the record, with an 86.2 percent likelihood. The next most likely candidate for warmest year on record was 2017, with a 12.5 percent probability.
“We’ve made the uncertainty quantification more rigorous, and the conclusion to come out of the study was that we can have confidence in the accuracy of our global temperature series,” said lead author Nathan Lenssen, a doctoral student at Columbia University. “We don’t have to restate any conclusions based on this analysis.”
Another recent study evaluated GISTEMP in a different way that also added confidence to its estimate of long-term warming. A paper published in March 2019, led by Joel Susskind of NASA's Goddard Space Flight Center, compared GISTEMP data with that of the Atmospheric Infrared Sounder (AIRS), onboard NASA's Aqua satellite.
GISTEMP uses air temperature recorded with thermometers slightly above the ground or sea, while AIRS uses infrared sensing to measure the temperature right at the Earth's surface (or “skin temperature”) from space. The AIRS record of temperature change since 2003 (which begins when Aqua launched) closely matched the GISTEMP record.
Comparing two measurements that were similar but recorded in very different ways ensured that they were independent of each other, Schmidt said. One difference was that AIRS showed more warming in the northernmost latitudes.
“The Arctic is one of the places we already detected was warming the most. The AIRS data suggests that it’s warming even faster than we thought,” said Schmidt, who was also a co-author on the Susskind paper.
Taken together, Schmidt said, the two studies help establish GISTEMP as a reliable index for current and future climate research.
“Each of those is a way in which you can try and provide evidence that what you’re doing is real,” Schmidt said. “We’re testing the robustness of the method itself, the robustness of the assumptions, and of the final result against a totally independent data set.”
In all cases, he said, the resulting trends are more robust than what can be accounted for by any uncertainty in the data or methods.
Access the paper here.
New Studies Increase Confidence in NASA's Measure of Earth's Temperature
By Jessica Merzdorf,
NASA's Goddard Space Flight Center
Earth’s long-term warming trend can be seen in this visualization of NASA’s global temperature record, which shows how the planet’s temperatures are changing over time, compared to a baseline average from 1951 to 1980. The record is shown as a running five-year average. Credit: NASA’s Scientific Visualization Studio/Kathryn Mersmann. Download related visualizations here.
A new assessment of NASA's record of global temperatures revealed that the agency's estimate of Earth's long-term temperature rise in recent decades is accurate to within less than a tenth of a degree Fahrenheit, providing confidence that past and future research is correctly capturing rising surface temperatures.
The most complete assessment ever of statistical uncertainty within the GISS Surface Temperature Analysis (GISTEMP) data product shows that the annual values are likely accurate to within 0.09 degrees Fahrenheit (0.05 degrees Celsius) in recent decades, and 0.27 degrees Fahrenheit (0.15 degrees C) at the beginning of the nearly 140-year record.
This data record, maintained by NASA’s Goddard Institute for Space Studies (GISS) in New York City, is one of a handful kept by major science institutions around the world that track Earth's temperature and how it has risen in recent decades. This global temperature record has provided one of the most direct benchmarks of how our home planet's climate has changed as greenhouse gas concentrations rise.
The study also confirms what researchers have been saying for some time now: that Earth's global temperature increase since 1880 – about 2 degrees Fahrenheit, or a little more than 1 degree Celsius – cannot be explained by any uncertainty or error in the data. Going forward, this assessment will give scientists the tools to explain their results with greater confidence.
GISTEMP is a widely used index of global mean surface temperature anomaly — it shows how much warmer or cooler than normal Earth’s surface is in a given year. "Normal" is defined as the average during a baseline period of 1951-80.
NASA uses GISTEMP in its annual global temperature update, in partnership with the National Oceanic and Atmospheric Administration. (In 2019, NASA and NOAA found that 2018 was the fourth-warmest year on record, with 2016 holding the top spot.) The index includes land and sea surface temperature data back to 1880, and today incorporates measurements from 6,300 weather stations, research stations, ships and buoys around the world.
Previously, GISTEMP provided an estimate of uncertainty accounting for the spatial gaps between weather stations. Like other surface temperature records, GISTEMP estimates the temperatures between weather stations using data from the closest stations, a process called interpolation. Quantifying the statistical uncertainty present in those estimates helped researchers to be confident that the interpolation was accurate.
“Uncertainty is important to understand because we know that in the real world we don’t know everything perfectly,” said Gavin Schmidt, director of GISS and a co-author on the study. “All science is based on knowing the limitations of the numbers that you come up with, and those uncertainties can determine whether what you’re seeing is a shift or a change that is actually important.”
The study found that individual and systematic changes in measuring temperature over time were the most significant source of uncertainty. Also contributing was the degree of weather station coverage. Data interpolation between stations contributed some uncertainty, as did the process of standardizing data that was collected with different methods at different points in history.
After adding these components together, GISTEMP’s uncertainty value in recent years was still less than a tenth of a degree Fahrenheit, which is “very small,” Schmidt said.
The team used the updated model to reaffirm that 2016 was very probably the warmest year in the record, with an 86.2 percent likelihood. The next most likely candidate for warmest year on record was 2017, with a 12.5 percent probability.
“We’ve made the uncertainty quantification more rigorous, and the conclusion to come out of the study was that we can have confidence in the accuracy of our global temperature series,” said lead author Nathan Lenssen, a doctoral student at Columbia University. “We don’t have to restate any conclusions based on this analysis.”
Another recent study evaluated GISTEMP in a different way that also added confidence to its estimate of long-term warming. A paper published in March 2019, led by Joel Susskind of NASA's Goddard Space Flight Center, compared GISTEMP data with that of the Atmospheric Infrared Sounder (AIRS), onboard NASA's Aqua satellite.
GISTEMP uses air temperature recorded with thermometers slightly above the ground or sea, while AIRS uses infrared sensing to measure the temperature right at the Earth's surface (or “skin temperature”) from space. The AIRS record of temperature change since 2003 (which begins when Aqua launched) closely matched the GISTEMP record.
Comparing two measurements that were similar but recorded in very different ways ensured that they were independent of each other, Schmidt said. One difference was that AIRS showed more warming in the northernmost latitudes.
“The Arctic is one of the places we already detected was warming the most. The AIRS data suggests that it’s warming even faster than we thought,” said Schmidt, who was also a co-author on the Susskind paper.
Taken together, Schmidt said, the two studies help establish GISTEMP as a reliable index for current and future climate research.
“Each of those is a way in which you can try and provide evidence that what you’re doing is real,” Schmidt said. “We’re testing the robustness of the method itself, the robustness of the assumptions, and of the final result against a totally independent data set.”
In all cases, he said, the resulting trends are more robust than what can be accounted for by any uncertainty in the data or methods.
Access the paper here.
April 13, 2019
2018: United-States

Energy Flow Diagrams
https://flowcharts.llnl.gov/commodities/energy2018: United-States
February 6, 2019
2018 Fourth Warmest Year in Continued Warming Trend, According to NASA, NOAA
(Please note, NASA press release—Copyright concerns are nil.)
https://www.nasa.gov/press-release/2018-fourth-warmest-year-in-continued-warming-trend-according-to-nasa-noaa
Feb. 6, 2019
RELEASE 19-002
2018 Fourth Warmest Year in Continued Warming Trend, According to NASA, NOAA
Earth's global surface temperatures in 2018 were the fourth warmest since 1880, according to independent analyses by NASA and the National Oceanic and Atmospheric Administration (NOAA).
Global temperatures in 2018 were 1.5 degrees Fahrenheit (0.83 degrees Celsius) warmer than the 1951 to 1980 mean, according to scientists at NASA’s Goddard Institute for Space Studies (GISS) in New York. Globally, 2018's temperatures rank behind those of 2016, 2017 and 2015. The past five years are, collectively, the warmest years in the modern record.
“2018 is yet again an extremely warm year on top of a long-term global warming trend,” said GISS Director Gavin Schmidt.
Since the 1880s, the average global surface temperature has risen about 2 degrees Fahrenheit (1 degree Celsius). This warming has been driven in large part by increased emissions into the atmosphere of carbon dioxide and other greenhouse gases caused by human activities, according to Schmidt.
Weather dynamics often affect regional temperatures, so not every region on Earth experienced similar amounts of warming. NOAA found the 2018 annual mean temperature for the contiguous 48 United States was the 14th warmest on record.
Warming trends are strongest in the Arctic region, where 2018 saw the continued loss of sea ice. In addition, mass loss from the Greenland and Antarctic ice sheets continued to contribute to sea level rise. Increasing temperatures can also contribute to longer fire seasons and some extreme weather events, according to Schmidt.
“The impacts of long-term global warming are already being felt — in coastal flooding, heat waves, intense precipitation and ecosystem change,” said Schmidt.
NASA’s temperature analyses incorporate surface temperature measurements from 6,300 weather stations, ship- and buoy-based observations of sea surface temperatures, and temperature measurements from Antarctic research stations.
These raw measurements are analyzed using an algorithm that considers the varied spacing of temperature stations around the globe and urban heat island effects that could skew the conclusions. These calculations produce the global average temperature deviations from the baseline period of 1951 to 1980.
Because weather station locations and measurement practices change over time, the interpretation of specific year-to-year global mean temperature differences has some uncertainties. Taking this into account, NASA estimates that 2018’s global mean change is accurate to within 0.1 degree Fahrenheit, with a 95 percent certainty level.
NOAA scientists used much of the same raw temperature data, but with a different baseline period and different interpolation into the Earth’s polar and other data poor regions. NOAA’s analysis found 2018 global temperatures were 1.42 degrees Fahrenheit (0.79 degrees Celsius) above the 20th century average.
NASA’s full 2018 surface temperature data set — and the complete methodology used to make the temperature calculation — are available at:
https://data.giss.nasa.gov/gistemp
GISS is a laboratory within the Earth Sciences Division of NASA’s Goddard Space Flight Center in Greenbelt, Maryland. The laboratory is affiliated with Columbia University’s Earth Institute and School of Engineering and Applied Science in New York.
NASA uses the unique vantage point of space to better understand Earth as an interconnected system. The agency also uses airborne and ground-based monitoring, and develops new ways to observe and study Earth with long-term data records and computer analysis tools to better see how our planet is changing. NASA shares this knowledge with the global community and works with institutions in the United States and around the world that contribute to understanding and protecting our home planet.
For more information about NASA’s Earth science missions, visit:
https://www.nasa.gov/earth
The slides for the Feb. 6 news conference are available at:
https://www.nasa.gov/sites/default/files/atoms/files/noaa-nasa_global_analysis-2018-final_feb6.pdf
NOAA’s Global Report is available at:
http://bit.ly/Global201812
-end-
Steve Cole
Headquarters, Washington
202-358-0918
stephen.e.cole@nasa.gov
Last Updated: Feb. 6, 2019
Editor: Sean Potter
RELEASE 19-002
2018 Fourth Warmest Year in Continued Warming Trend, According to NASA, NOAA
Earth's global surface temperatures in 2018 were the fourth warmest since 1880, according to independent analyses by NASA and the National Oceanic and Atmospheric Administration (NOAA).
Global temperatures in 2018 were 1.5 degrees Fahrenheit (0.83 degrees Celsius) warmer than the 1951 to 1980 mean, according to scientists at NASA’s Goddard Institute for Space Studies (GISS) in New York. Globally, 2018's temperatures rank behind those of 2016, 2017 and 2015. The past five years are, collectively, the warmest years in the modern record.
“2018 is yet again an extremely warm year on top of a long-term global warming trend,” said GISS Director Gavin Schmidt.
Since the 1880s, the average global surface temperature has risen about 2 degrees Fahrenheit (1 degree Celsius). This warming has been driven in large part by increased emissions into the atmosphere of carbon dioxide and other greenhouse gases caused by human activities, according to Schmidt.
Earth’s long-term warming trend can be seen in this visualization of NASA’s global temperature record, which shows how the planet’s temperatures are changing over time, compared to a baseline average from 1951 to 1980. The record is shown as a running five-year average.
Credits: NASA’s Scientific Visualization Studio/Kathryn Mersmann
Download high-definition video and still imagery here.
Weather dynamics often affect regional temperatures, so not every region on Earth experienced similar amounts of warming. NOAA found the 2018 annual mean temperature for the contiguous 48 United States was the 14th warmest on record.
Warming trends are strongest in the Arctic region, where 2018 saw the continued loss of sea ice. In addition, mass loss from the Greenland and Antarctic ice sheets continued to contribute to sea level rise. Increasing temperatures can also contribute to longer fire seasons and some extreme weather events, according to Schmidt.
“The impacts of long-term global warming are already being felt — in coastal flooding, heat waves, intense precipitation and ecosystem change,” said Schmidt.
NASA’s temperature analyses incorporate surface temperature measurements from 6,300 weather stations, ship- and buoy-based observations of sea surface temperatures, and temperature measurements from Antarctic research stations.
This line plot shows yearly temperature anomalies from 1880 to 2018, with respect to the 1951-1980 mean, as recorded by NASA, NOAA, the Japan Meteorological Agency, the Berkeley Earth research group, and the Met Office Hadley Centre (UK). Though there are minor variations from year to year, all five temperature records show peaks and valleys in sync with each other. All show rapid warming in the past few decades, and all show the past decade has been the warmest.
Credits: NASA’s Earth Observatory

These raw measurements are analyzed using an algorithm that considers the varied spacing of temperature stations around the globe and urban heat island effects that could skew the conclusions. These calculations produce the global average temperature deviations from the baseline period of 1951 to 1980.
Because weather station locations and measurement practices change over time, the interpretation of specific year-to-year global mean temperature differences has some uncertainties. Taking this into account, NASA estimates that 2018’s global mean change is accurate to within 0.1 degree Fahrenheit, with a 95 percent certainty level.
NOAA scientists used much of the same raw temperature data, but with a different baseline period and different interpolation into the Earth’s polar and other data poor regions. NOAA’s analysis found 2018 global temperatures were 1.42 degrees Fahrenheit (0.79 degrees Celsius) above the 20th century average.
NASA’s full 2018 surface temperature data set — and the complete methodology used to make the temperature calculation — are available at:
https://data.giss.nasa.gov/gistemp
GISS is a laboratory within the Earth Sciences Division of NASA’s Goddard Space Flight Center in Greenbelt, Maryland. The laboratory is affiliated with Columbia University’s Earth Institute and School of Engineering and Applied Science in New York.
NASA uses the unique vantage point of space to better understand Earth as an interconnected system. The agency also uses airborne and ground-based monitoring, and develops new ways to observe and study Earth with long-term data records and computer analysis tools to better see how our planet is changing. NASA shares this knowledge with the global community and works with institutions in the United States and around the world that contribute to understanding and protecting our home planet.
For more information about NASA’s Earth science missions, visit:
https://www.nasa.gov/earth
The slides for the Feb. 6 news conference are available at:
https://www.nasa.gov/sites/default/files/atoms/files/noaa-nasa_global_analysis-2018-final_feb6.pdf
NOAA’s Global Report is available at:
http://bit.ly/Global201812
-end-
Steve Cole
Headquarters, Washington
202-358-0918
stephen.e.cole@nasa.gov
Last Updated: Feb. 6, 2019
Editor: Sean Potter
February 6, 2019
Diffusing the methane bomb: We can still make a difference
http://www.iiasa.ac.at/web/home/about/news/190206-Tundra-methane.html06 February 2019
Diffusing the methane bomb: We can still make a difference
The Arctic is warming twice as fast as the rest of the planet, causing the carbon containing permafrost that has been frozen for tens or hundreds of thousands of years to thaw and release methane into the atmosphere, thereby contributing to global warming. The findings of a study that included researchers from IIASA, however, suggest that it is still possible to neutralize this threat
…
In their analysis, the researchers quantified the upper range value for natural methane emissions that can be released from the Arctic tundra, as it allows it to be put in relation to the much larger release of methane emissions from human activities. Although estimates of the release of methane from natural sources in the Arctic and estimates of methane from human activity have been presented separately in previous studies, this is the first time that the relative contribution of the two sources to global warming has been quantified and compared.
…
According to the researchers, their findings confirm the urgency of a transition away from a fossil fuel based society as well as the importance of reducing methane emissions from other sources, in particular livestock and waste. The results indicate that man-made emissions can be reduced sufficiently to limit methane-caused climate warming by 2100 even in the case of an uncontrolled natural Arctic methane emission feedback. This will however require a committed, global effort towards substantial, but feasible reductions.
“In essence, we want to convey the message that the release of methane from human activities is something we can do something about, especially since the technology for drastic reductions is readily available - often even at a low cost. If we can only get the human emissions under control, the natural emissions should not have to be of major concern,” concludes Höglund-Isaksson.
…
https://dx.doi.org/10.1038/s41598-018-37719-9
Diffusing the methane bomb: We can still make a difference
The Arctic is warming twice as fast as the rest of the planet, causing the carbon containing permafrost that has been frozen for tens or hundreds of thousands of years to thaw and release methane into the atmosphere, thereby contributing to global warming. The findings of a study that included researchers from IIASA, however, suggest that it is still possible to neutralize this threat
…
In their analysis, the researchers quantified the upper range value for natural methane emissions that can be released from the Arctic tundra, as it allows it to be put in relation to the much larger release of methane emissions from human activities. Although estimates of the release of methane from natural sources in the Arctic and estimates of methane from human activity have been presented separately in previous studies, this is the first time that the relative contribution of the two sources to global warming has been quantified and compared.
…
According to the researchers, their findings confirm the urgency of a transition away from a fossil fuel based society as well as the importance of reducing methane emissions from other sources, in particular livestock and waste. The results indicate that man-made emissions can be reduced sufficiently to limit methane-caused climate warming by 2100 even in the case of an uncontrolled natural Arctic methane emission feedback. This will however require a committed, global effort towards substantial, but feasible reductions.
“In essence, we want to convey the message that the release of methane from human activities is something we can do something about, especially since the technology for drastic reductions is readily available - often even at a low cost. If we can only get the human emissions under control, the natural emissions should not have to be of major concern,” concludes Höglund-Isaksson.
…
August 1, 2017
An inevitable warm-up for Earth
Published: July 31, 2017
Even if humans could instantly turn off all emissions of greenhouse gases, Earth would continue to heat up about two more degrees Fahrenheit by the turn of the century, according to a sophisticated new analysis published today in the journal Nature Climate Change.
If current emission rates continue for 15 years, the research shows, odds are good that the planet will see nearly three degrees Fahrenheit (1.5 Celsius) of warming by then.
“This ‘committed warming’ is critical to understand because it can tell us and policymakers how long we have, at current emission rates, before the planet will warm to certain thresholds,” said Robert Pincus, a scientist with the Cooperative Institute for Research in Environmental Sciences (CIRES), a partnership of the University of Colorado Boulder and NOAA. “The window of opportunity on a 1.5-degree [C] target is closing.”
During United Nations meetings in Paris last year, 195 countries including the United States signed an agreement to keep global temperature rise less than 3.5 degrees F (2 C) above pre-industrial levels, and pursue efforts that would limit it further, to less than 3 degrees Fahrenheit (1.5 C) by 2100.
…
http://dx.doi.org/10.1038/NCLIMATE3357
An inevitable warm-up for Earth
http://www.colorado.edu/today/2017/07/31/inevitable-warm-earthAn inevitable warm-up for Earth
Published: July 31, 2017
Even if humans could instantly turn off all emissions of greenhouse gases, Earth would continue to heat up about two more degrees Fahrenheit by the turn of the century, according to a sophisticated new analysis published today in the journal Nature Climate Change.
If current emission rates continue for 15 years, the research shows, odds are good that the planet will see nearly three degrees Fahrenheit (1.5 Celsius) of warming by then.
“This ‘committed warming’ is critical to understand because it can tell us and policymakers how long we have, at current emission rates, before the planet will warm to certain thresholds,” said Robert Pincus, a scientist with the Cooperative Institute for Research in Environmental Sciences (CIRES), a partnership of the University of Colorado Boulder and NOAA. “The window of opportunity on a 1.5-degree [C] target is closing.”
During United Nations meetings in Paris last year, 195 countries including the United States signed an agreement to keep global temperature rise less than 3.5 degrees F (2 C) above pre-industrial levels, and pursue efforts that would limit it further, to less than 3 degrees Fahrenheit (1.5 C) by 2100.
…
http://dx.doi.org/10.1038/NCLIMATE3357
August 1, 2017
Methane-eating microbes found beneath Antarctica's melting ice sheets
July 31, 2017
Rachel Damiani
photographer: Reed Scherer
Lurking in a lake half a mile beneath Antarctica’s icy surface, methane-eating microbes may mitigate the release of this greenhouse gas into the atmosphere as ice sheets retreat.
A new study published today in Nature Geoscience traces methane’s previously unknown path below the ice in a spot that was once thought to be inhospitable to life. Study researchers sampled the water and sediment in Antarctica’s subglacial Whillans Lake by drilling 800 meters through ice for the first time ever. Next they measured methane amounts and used genomic analyses to find that 99 percent of methane released into the lake is gobbled up by microbes.
These tiny microorganisms may have a big impact on a warming world by preventing methane from seeping into the atmosphere when ice sheets melt, said Brent Christner, a University of Florida microbiologist and co-author on the study.
“This is an environment that most people look at and don’t think it could ever really directly impact us,” Christner said. “But this is a process that could have climatic implications.”
…
http://dx.doi.org/10.1038/ngeo2992
Methane-eating microbes found beneath Antarctica's melting ice sheets
http://news.ufl.edu/articles/2017/07/methane-eating-microbes-found-beneath-antarcticas-melting-ice-sheets-.phpMethane-eating microbes found beneath Antarctica's melting ice sheets
July 31, 2017
Rachel Damiani
photographer: Reed Scherer
Lurking in a lake half a mile beneath Antarctica’s icy surface, methane-eating microbes may mitigate the release of this greenhouse gas into the atmosphere as ice sheets retreat.
A new study published today in Nature Geoscience traces methane’s previously unknown path below the ice in a spot that was once thought to be inhospitable to life. Study researchers sampled the water and sediment in Antarctica’s subglacial Whillans Lake by drilling 800 meters through ice for the first time ever. Next they measured methane amounts and used genomic analyses to find that 99 percent of methane released into the lake is gobbled up by microbes.
These tiny microorganisms may have a big impact on a warming world by preventing methane from seeping into the atmosphere when ice sheets melt, said Brent Christner, a University of Florida microbiologist and co-author on the study.
“This is an environment that most people look at and don’t think it could ever really directly impact us,” Christner said. “But this is a process that could have climatic implications.”
…
http://dx.doi.org/10.1038/ngeo2992
June 28, 2017
http://dx.doi.org/10.1002/2016GL068999.
Methane not escaping into the atmosphere from Arctic Ocean
https://cage.uit.no/news/methane-not-escaping-into-the-atmosphere-arctic-ocean/[font face=Serif]27/05/2016
[font size=5]Methane not escaping into the atmosphere from Arctic Ocean[/font]
[font size=4]Methane gas released from the Arctic seabed during the summer months leads to an increased methane concentration in the ocean. But surprisingly, very little of the climate gas rising up through the sea reaches the atmosphere.[/font]
[font size=3]“Our results are exciting and controversial”, says senior scientist Cathrine Lund Myhre from NILU – Norwegian Institute for Air Research, who is cooperating with CAGE through MOCA project.
The results were published in Geophysical Research Letters.
The scientist performed simultaneous measurements close to seabed, in the ocean and in the atmosphere during an extensive ship and air campaign offshore Svalbard Archipelago in summer 2014. As of today, three independent models employing the marine and atmospheric measurements show that the methane emissions from the sea bed in the area did not significantly affect the atmosphere.
…[/font][/font]
http://dx.doi.org/10.1002/2016GL068999.
Profile Information
Member since: Mon Mar 6, 2006, 04:51 PMNumber of posts: 19,938