NNadir
NNadir's JournalDifferentiating Parallel and Antiparallel DNA Duplexes in the Gas Phase.
The paper I'll discuss in this post is this one: Differentiating Parallel and Antiparallel DNA Duplexes in the Gas Phase Using Trapped Ion Mobility Spectrometry (David Butcher, Prem Chapagain, Fenfei Leng, Francisco Fernandez-Lima,* J. Phys. Chem. B 2018 122 27 6855-6861)
When I was a kid, I had the silly notion that biological molecules featuring regular repeating units - peptides, proteins, polysaccharides, nucleic acids and more or less lipids were disinteresting - and to the extent that one could be interested in biological molecules, they had to be natural products with a ton of stereochemistry to confound efforts at total synthesis. In this context, I held the absurd opinion that the main interesting analytical tool was NMR and everything else was ancillary.
I was a stupid kid.
I was forced by circumstances to make myself aware of and knowledgeable about the "regular" biomolecules, which are actually far more exciting and interesting that I could have possibly imagined as a dumb kid.
I almost never think about NMR now; I know it's a powerful tool; and can reveal a lot, but as an old man the analytical tool that is the most amazing to me and the most important is chromatographically coupled mass spectrometry.
The advent of high resolution mass spec has changed the world and gave us one of the best tools to interrogate molecular biology.
Thus I found this paper extremely interesting when I stumbled across it recently in a journal in which I don't spend all that much time.
Some cool stuff about why DNA is decidedly not simple from the intro:
DNA sequences may also associate in a parallel fashion, resulting in a parallel duplex in which both strands run in the same direction. The parallel-stranded duplex is stabilized by the formation of reverse Watson?Crick A-T or G-C base pairs.11 Previous studies have established significant structural and spectroscopic differences between parallel- and antiparallel- stranded complexes.11,12 The formation of parallelstranded duplexes has been observed in vitro in sequences from the genome of Drosophila melanogaster,13 suggesting that parallel-stranded duplexes, like other atypical DNA structural motifs, may be relevant in vivo.
The structure of DNA structural motifs in the gas phase has been characterized using molecular dynamics simulations and various ion mobility spectrometry techniques.14?17 It has been demonstrated that soft ionization techniques such as nanoelectrospray ionization (nESI) can produce desolvated DNA molecular ions which retain a memory of their solution structure...15
...Here, native electrospray ionization combined with trapped ion mobility spectrometry (TIMS) and ultrahigh-resolution time-of-flight mass spectrometry (UHR-TOF-MS) was used for the first time to characterize the conformational space and oligomerization states of two parallel strand-forming oligonucleotides:
psDNA1 (5?-CCATAATTTACC-3? ) and psDNA2 (5?-CCTATTAAATCC-3? ). These oligomers have been confirmed to form a parallel-stranded duplex in acidic solution...
The mass spec here has an added dimension in ion mobility, which depends on the cross sectional area of a charged analytic fragment drifting in an electric field in a "drift tube."
(I've heard good things about the Bruker High Resolution Mass Specs used in this paper, even if I have very limited exposure to them, and never actually thought to have a representative in to discuss them.)
Some pictures from the paper:


From data collected from the drift tube, one can calculate the cross sectional area of the molecule, that is the "electronic shadow" of the molecule and thus make inferences about its conformation (3D structure):
 using the Mason?Schamp equation

where z is the charge of the ion, kB is the Boltzmann constant, N* is the number density of the bath gas, and mi and mb refer to the masses of the ion and bath gas, respectively [33]. TIMSMS spectra were analyzed using Compass Data Analysis 5.0 (Bruker Daltonik GmbH) and TIMS Data Viewer 1.4.0.31397 (Bruker Daltonik GmbH).
Some conclusions:
We have shown that DNA structures undergo compaction upon transfer to the gas phase, resulting in observed ? values significantly smaller than theoretical predictions based on solution-phase structures. There is also a significant difference in ? for parallel- and antiparallel-stranded duplexes measured in positive mode and negative mode. Changes in the pattern of protonation as a result of the ionization process are likely responsible for the significantly smaller ? values observed in negative mode as compared to positive mode (?? ? 100 Å^2).
Esoteric, but very cool. IMS makes it possible to derive conformational information from mass spectrometry.
Very cool...very cool.
Have a happy Friday tomorrow.
I am an evil person. I bought a robot to feed our cat.
We have to leave town for 5 days to set up my son at an internship far away.
The only person in our neighborhood who we felt comfortable to feed the cat was out of town when we went to call him.
So we went looking for a robot. We asked at a local dog and cat accessories store if they sold cat feeding robots and the owner sneered at us and said, "we would never sell them."
A nice lady overheard us, and came up to us outside to say she had a cat feeding robot, but her cat was too neurotic to use it, and she offered to sell it to us.
So we bought it. We're testing it. It allowed us to record our voices, and I recorded my voice insulting the cat, but because of what Pavlov discovered, she thinks this insult means she is either about to be petted or fed, sometimes both.
It feeds the cat quite well, and more systematically than we do, since we're inclined to let the cat become obese since we give in to cat nagging. The robot couldn't care less what the cat thinks.
The cat eats from it, albeit grudgingly.
The kid who was out of town, came back and we hired him to come in and pet the cat, but basically his job otherwise has been automated away by a robot.
I am a bad person.
Not only that, but I just found out that my kid, the one we're driving to the internship, has programmed a computer in an AI application to look for cracks in materials, putting microscopists out of work.
We're a family of bad people.
Concerned About the Planetary Climate, the IEA Urges Rethinking Nuclear Phase Outs.
Nuclear is currently the world’s second-largest source of low-carbon electricity, behind hydropower, and accounting for 10 percent of global electricity generation. But nuclear fleets in the United States and Europe are on average more than 35 years old and many of the world’s 452 reactors are set to close as cheap gas and tighter safety requirements make it uneconomical to operate them.
“Without policy changes, advanced economies could lose 25 percent of their nuclear capacity by 2025 and as much as two-thirds of it by 2040,” the IEA writes in its first major report about nuclear energy in two decades.
Over the past 20 years, wind and solar capacity has increased by 580 gigawatt GW in advanced economies. Despite that, however, IEA estimates that the 36 percent share of clean energy sources in global power supply in 2018 was the same as two decades ago because of the decline in nuclear.
IEA rings alarm bell on phasing out nuclear energy
The added bold is mine. I note that considering so called "renewable energy" in terms of peak power as opposed to energy is a commonly used Trump scale lie. "580 GW" of so called "renewable energy" operating at 30% capacity utilization is - fairly typical for so called "renewable energy - in terms of average continuous power represents about 175 GW of nuclear power, since nuclear power is capable of running at or near 100% capacity utilization. Moreover, nuclear power plants do not require redundant gas, oil or coal plants to cover them when they aren't operating.
We have, in this country, shit for brains people like President Obama's worst appointment, Gregory Jaczko, who wrote this piece of head up the ass bit of preciousness: I oversaw the U.S. nuclear power industry. Now I think it should be banned.
He declares, more than half a century into commercial nuclear operations, the experimental result being an extraordinarily low death toll, that "nuclear power is more dangerous than climate change." I note that this weak minded fool did not regulate the dangerous fossil fuel industry - which is allowed to dump it's wastes directly into the planetary atmosphere - which kills, along with biomass burning, 7 million people a year, but in his mind is not "too dangerous."
Here is the most recent full report from the Global Burden of Disease Report, a survey of all causes of death and disability from environmental and lifestyle risks: Global, regional, and national comparative risk assessment of 79 behavioural, environmental and occupational, and metabolic risks or clusters of risks, 1990–2015: a systematic analysis for the Global Burden of Disease Study 2015 (Lancet 2016; 388: 1659–724) One can easily locate in this open sourced document compiled by an international consortium of medical and scientific professionals how many people die from causes related to air pollution, particulates, ozone, etc.
Apparently in Jaczko's weak mind, destroying the planetary atmosphere is also not "too dangerous." His attitude, like that of most anti-nukes, is "who gives a rat's ass about future generations, it's their responsibility to do what we are incompetent to do ourselves, live without dangerous fossil fuels."
President Obama's best appointment in the field of energy and the environment was of course Nobel Laureate Steven Chu, who lead the charge to get nuclear reactor construction resumed in the United States.
Obviously Dr. Chu had a very different opinion than that asshole Dr. Jaczko.
It is not enough, by the way, to simply keep reactors built in the 20th century going. We need new reactors, reactors of different types, capable of high temperatures to remove carbon dioxide atmosphere. This is on the edge of technical feasibility.
We hit 415 ppm concentrations of the dangerous fossil fuel waste carbon dioxide this year, this after "investing" trillions of dollars in last ten years alone for solar and wind. Things are not getting better; they're getting worse.
The annual increases in the dangerous fossil fuel waste carbon dioxide in the planetary atmosphere have now approached 2.4 ppm/year. So called "renewable energy" has not worked; is not working; and will not work.
History will not forgive us, nor should it.
I wish you a nice day.
Climatic controls of decomposition drive the global biogeography of forest-tree symbioses.
The paper I'll discuss in this post is this one: Climatic controls of decomposition drive the global biogeography of forest-tree symbioses.
The lead authors are T. W. Crowther, of ETH is Switzerland, J. Liang, who apparently holds a dual appointment at Research Center of Forest Management Engineering of State Forestry and Grassland Administration, Beijing Forestry University, Beijing, China and Purdue University, and K. G. Peay at Stanford University.
The data was collected by multiple other authors from around the world and by appeal to data produced by an international consortium of scientists (of which I was unaware), GFBI, the Global Forest Biodiversity Initiative.
The existence of the GFBI is a wonderful thing; there are people who are fighting what we are doing to the planet, and, of course, many of us, a minority perhaps, wish them well. The international rise and celebration of ignorance, left and right, has made focus on biodiversity in forests a somewhat quixotic enterprise, but that's just my opinion. (I would love, absolutely love to be proved wrong, although I have the unfortunate experience of having been right about more things than I would have liked, at least where climate change is connected, climate change being the focus of this paper. We hit 415 ppm this year and are doing nothing, absolutely nothing practical to address it, and, no, Musk worship and battery worship won't cut it.)
The reference for the paper is Nature 569, 404–408 (2019).
Anyway.
Even a cursory study of biochemistry can inspire a sense of awe for the dance of elements by which living things exist. In recent times many of us think about carbon and hydrogen, but the extreme stability of dinitrogen, the main constituent of our dying planetary atmosphere, places powerful energy constraints on the availability of fixed nitrogen. Other critical elements include phosphorous, the key to nucleic acids, protein signaling and the energetics of all living things, and many minor elements including, interestingly one of the only two elements in the 5th period of periodic table to be essential to life, molybdenum, the other such element being iodine.
Dinitrogenase, the protein that fixes nitrogen from the air, has a molybdenum coordinating center which is the catalytic site. (Interestingly this element may play a role in low energy catalysts to replace the energy consuming Haber Bosch process, which consumes about 2% of the world energy supply: New process could slash energy demands of fertilizer, nitrogen-based chemicals
(The mindless acceptance of "could" statements, as having more value than "is" or "are" statements are part of the reason that climate change is accelerating. This is not a criticism of Dr. Carter, who is a certifiable genius of the first order, but rather a reflection of how people interpret "could" statements as being equivalent to "problem solved."
I had an opportunity, after one of her lectures, during Q&A to ask Dr. Carter what it is about molybdenum, to which she kind of shrugged and said, "It's the energy of the d-orbitals, I guess." In any case, life understood the energy minimization associated with molybdenum and nitrogen before Dr. Carter did.
Many of us are aware of the symbiont role played by organisms in such species as peas and soybeans where nitrogen fixation is concerned, and this was the basis for crop rotation before the industrialization of agriculture in the "green revolution" of the mid 20th century which, unlike the "green revolution" advertised in the late 20th and early 21st century, worked. The food supply increased to levels sufficient to support billions of more human lives, albeit at the cost of considerable expense to the environment.
But the paper focuses on the environment.
From the introductory text:
The dominant guilds of tree root symbionts—arbuscular mycorrhizal fungi, ectomycorrhizal fungi, ericoid mycorrhizal fungi and nitrogen-fixing bacteria (N-fixers)—are all based on the exchange of plant photosynthate for limiting macronutrients. Arbuscular mycorrhizal symbiosis evolved nearly 500 million years ago, and ectomycorrhizal, ericoid mycorrhizal and N-fixer plant taxa have evolved multiple times from an arbuscular-mycorrhizal basal state. Plants that are involved in arbuscular mycorrhizal symbiosis comprise nearly 80% of all terrestrial plant species; these plants principally rely on arbuscular mycorrhizal fungi for enhancing mineral phosphorus uptake12. In contrast to arbuscular mycorrhizal fungi, ectomycorrhizal fungi evolved from multiple lineages of saprotrophic ancestors and, as a result, some ectomycorrhizal fungi are capable of directly mobilizing organic sources of soil nutrients (particularly nitrogen)2.
So it turns out that these symbiotic relationships are as important for phosphorous as they are for nitrogen. (By the way, we are mining the hell out of the world's phosphorous for our industrial agriculture and for the all important task of keeping the grass nice on golf courses.)
Later, the authors discuss the known role of temperature to the mycorrhizal species:
...To address this, we compiled a global ground-sourced survey database to reveal the numerical abundances of each type of symbiosis across the globe. Such a database is essential for identifying the potential mechanisms that underlie transitions in forest symbiotic state along climatic gradients18,19.
We determined the abundance of tree symbioses using an extension of the plot-based Global Forest Biodiversity (GFB) database that we term the GFBi; this extended database contains over 1.1 million forest inventory plots of individual-based measurement records, from which we derive abundance information for entire tree communities (Fig. 1).
The authors used "training sets" to generate the "artificial intelligence" tools to process their data.
A picture from the paper:
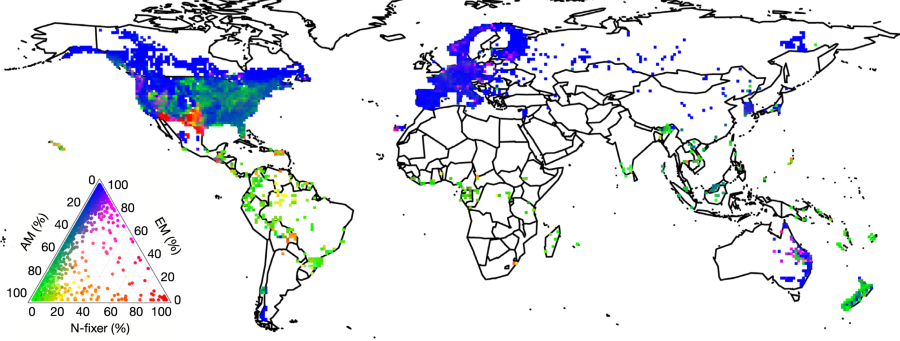
The caption:
They find that only a small number factors control decomposition of forest litter and turnover of essential nutrients:
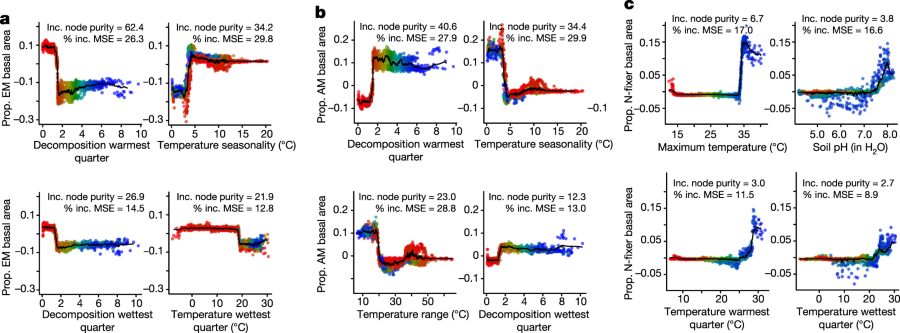
The caption:
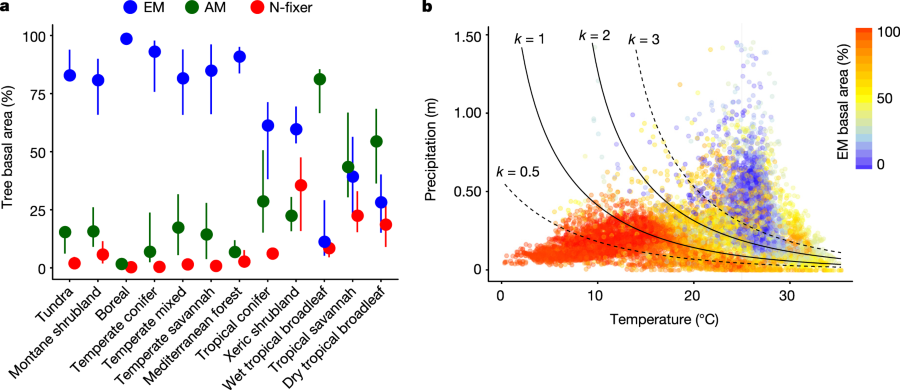
Their software tools predict the types of symbiotic relationships that dominate forests.
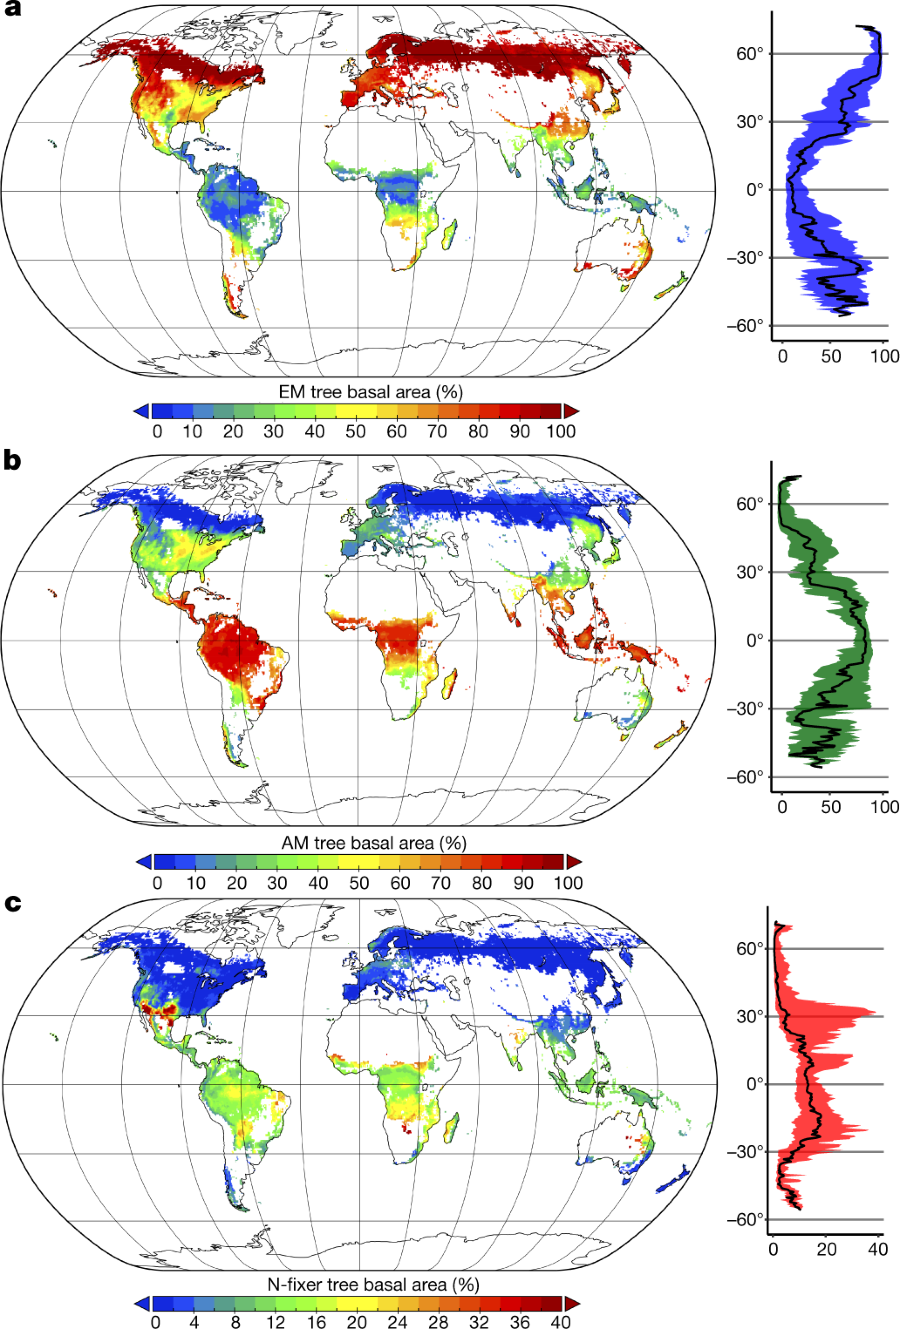
The caption:
Some disturbing stuff, at least to me, since while I encourage other people to not worry and be happy in order to embrace popular trends, I do worry and am not happy and my thoughts are perhaps, unpopular and unpleasant:
But again, don't worry, be happy. If our boreal forests die off, maybe, just maybe, we can have new kinds of forests, maybe even steel forests. It's a transition, just like the swell transition we're undergoing from coal to gas while we wait, like Godot, for the grand so called "renewable energy" nirvana that has not come, is not here, and will not come.
But anyway, who cares? Forests are not popular really. On the right, no matter how much real estate and how many crops in the red states are destroyed by extreme weather events there is no willingness to acknowledge that climate change is real.
On the left, we plan to cover all of our pristine forests with access roads to our wind turbine laced industrial parks so we can drive through the industrial parks where the forests used to be with diesel trucks and of course, our swell Tesla electric cars.
Either way the forests, and the atmosphere lose.
And sorry, the forests are in no position to mitigate climate change.
History will not forgive us; nor should it.
I trust you're having a wonderful Memorial Day holiday.
Superconductivity Observed at 250K, (-23C).
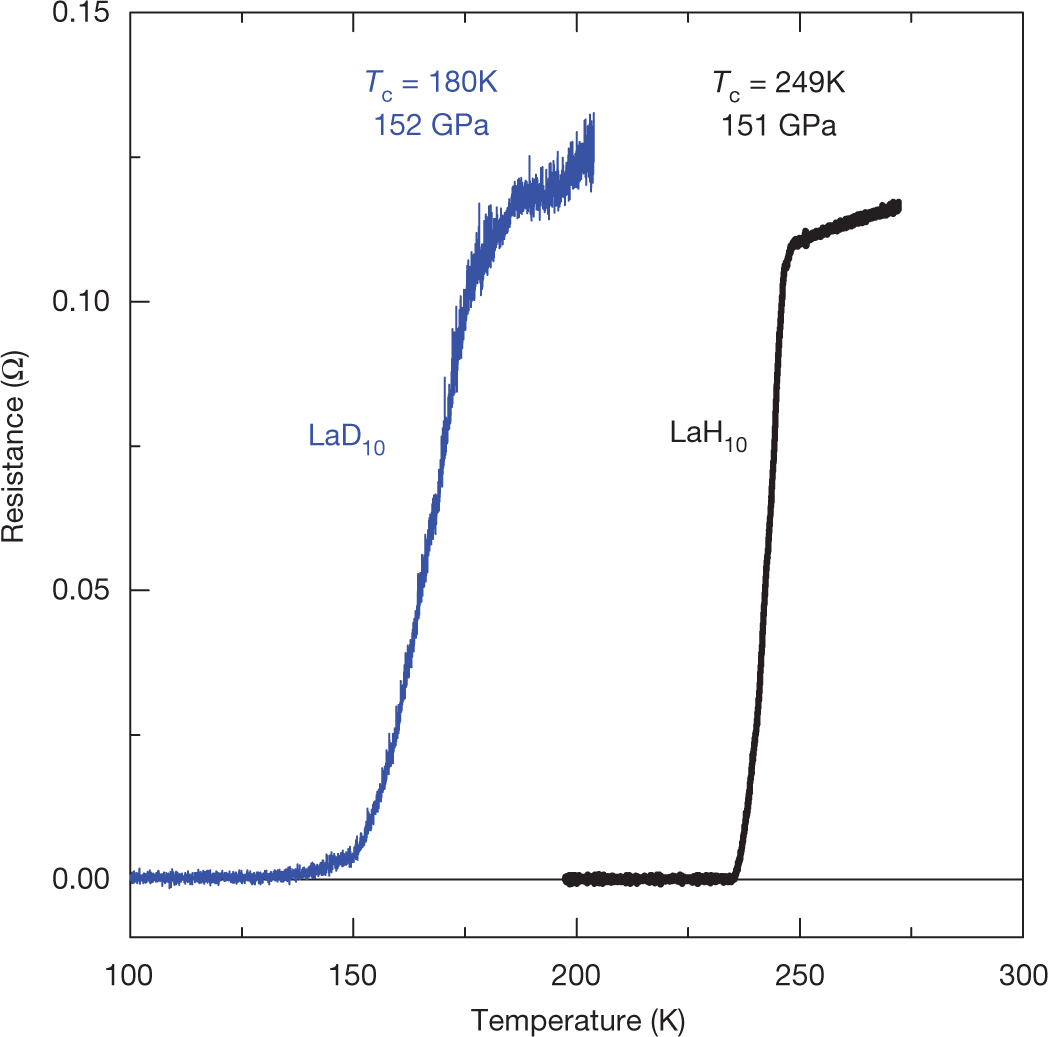
The paper I'll discuss in this post is this one: Superconductivity at 250 K in lanthanum hydride under high pressures (M. I. Eremets et al, Nature Nature 569, 528–531 (2019).
Superconductivity, as most people know, is a property of a material to conduct electricity without losing energy. Many commercial instruments exploiting superconductivity are known; the most familiar to most people are MRI (Magnetic Resonance Instruments) medical diagnostic devices, descendants of the NMR (nuclear magnetic resonance), with the word "nuclear" having been dropped from the name as a genuflection of fear of fear and ignorance with respect to the word "nuclear."
In MRI devices in use today, the superconductive wire utilized is an alloy of niobium and titanium, the former being a "conflict" metal often mined by enslaved children as the mineral "coltan," reflecting a historical name for the element niobium, "columbium," as well as the other constituent, used in cell phones, “tantalum.” “Columbium” was ultimately rejected by the IUPAC as a name for niobium. To achieve superconductivity in niobium/tantanlum alloy, it is necessary to bathe the wire in liquid helium, with the liquid helium itself being bathed in liquid nitrogen.
As noted in this space elsewhere by another correspondent, all of the helium on earth, when released into the atmosphere, ultimately boils off into space as a consequence of the relatively weak gravitational field of the earth compared to Jupiter and Saturn, because, as one can learn by playing with the Maxwell-Boltzmann equation, a significant portion of helium molecules have velocities at normal temperatures exceeding the escape velocity of Earth, 11.2 km/sec, these velocities being a function of atomic or molecular weight with respect to the internal energy represented by temperature.
The current availability of helium is the result of helium trapped in rocks and produced by the decay of uranium (and to a lesser extent, thorium) and their daughters in the Earth's crust. It is generally obtained from dangerous natural gas wells.
Superconductivity at temperatures corresponding to the temperature of liquid nitrogen are known, and have been known for some time, however the superconductive materials are ceramics which cannot be drawn into wire, and are only able to carry limited amounts of current.
While the lanthanum hydride investigated in this study is unlikely to have practical use - I say this in lieu of hearing once again how wind turbines in North Dakota "could" power New York - it does help establish a basis for the discovery of new superconductive materials.
From the text:
The discovery of superconductivity at 203 K in H3S1 at high pressures offered another route in the search for high-temperature superconductivity in conventional superconductors9. It provided the first confirmation of the predictions of the Bardeen–Cooper–Schrieffer and Migdal–Eliashberg theories regarding the possibility of high-temperature superconductivity in materials with high phonon frequencies10. In principle, hydrogen- and carbon-abundant materials can provide the required high frequencies in the phonon spectrum as well as a strong electron–phonon interaction11,12. Advances in the experimental search for room-temperature superconductivity came from crystal-structure predictions based on density functional theory13,14,15,16: the electron and phonon spectra as well as the transition temperatures can be estimated from density functional and Migdal–Eliashberg theories. First-principles theories of superconductivity are also progressing17,18. At present, nearly all of the binary hydrides have been studied theoretically13,14,15, and calculations are now focusing on the ternary compounds19.
Some pictures from the text:

The caption:
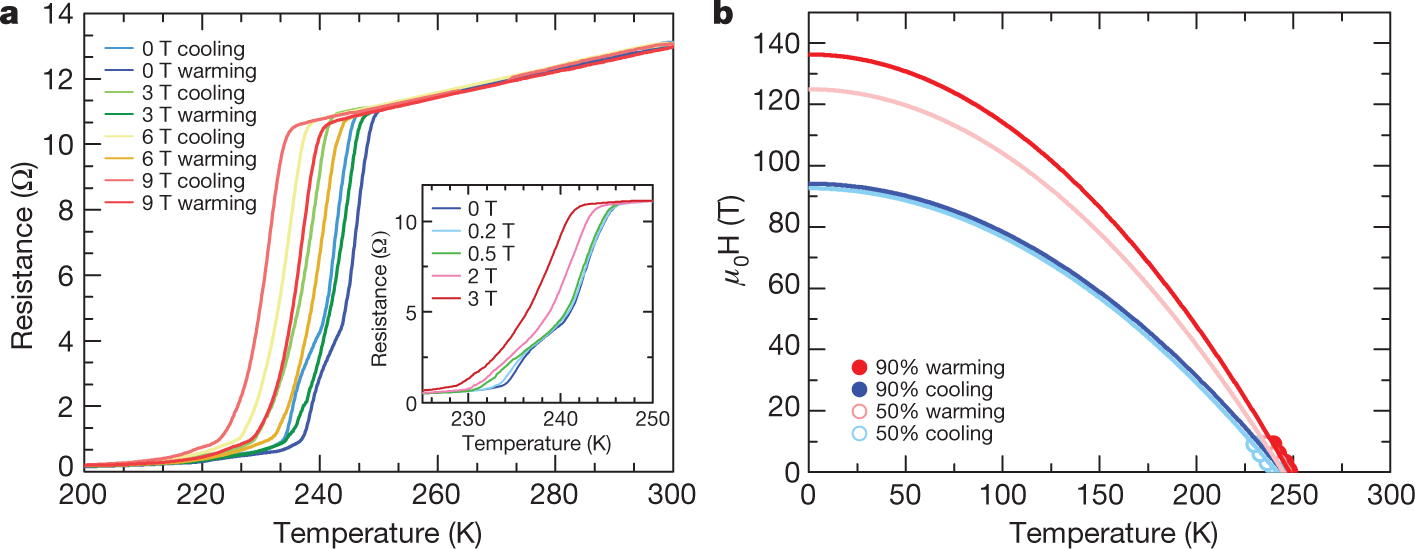
The caption:
deduced from these Hc2(0) values range between 1.56 and 1.86 nm.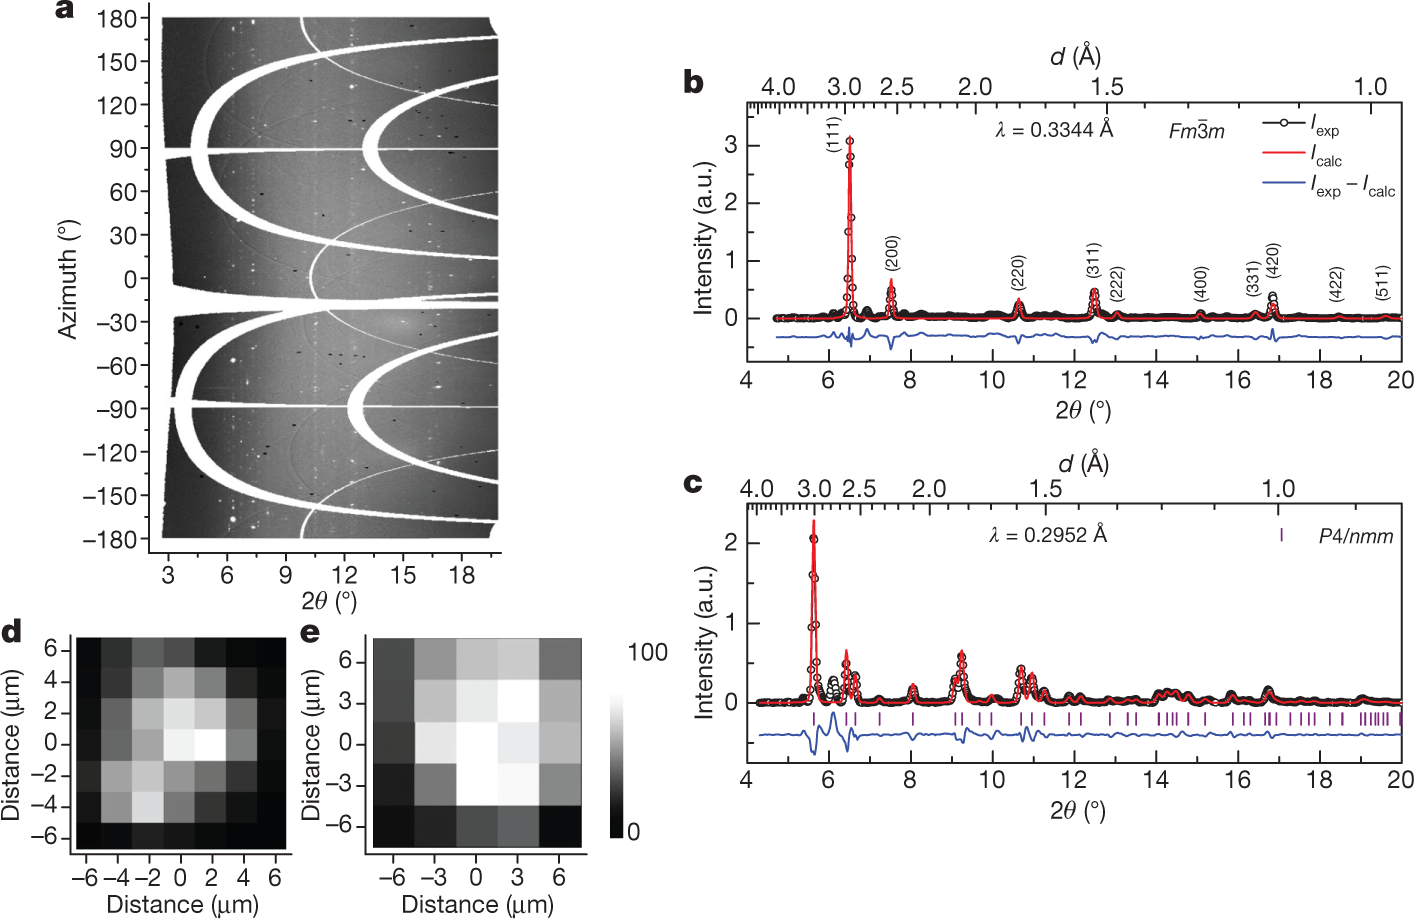
The caption:
Summary conclusions:
We may not be aware of this, but the use of superconductive materials influences our lives.
I trust you're enjoying the holiday weekend.
We Apparently Reached the Annual High for Atmospheric CO2 at Mauna Loa Last Week, 415.39 ppm.
Each year, the maximal value for carbon dioxide levels in the atmosphere for a particular year is observed in the Northern Hemisphere's spring. The Mauna Loa Observatory reports weekly year to year increases for each week of the current year compared to the same week in the previous year.
This year, in 2019, as is pretty much the case for the entire 21st century, these maxima represent the highest concentrations of carbon dioxide ever recorded going back to 1958, when the Mauna Loa carbon dioxide observatory first went into operation. Weekly data is available on line, however, only going back to the week of May 25, 1975, when the reading was 332.98 ppm.
The new data is posted on line on Sundays.
Here is this week's data:
Week beginning on May 19, 2019: 414.74 ppm
Weekly value from 1 year ago: 411.44 ppm
Weekly value from 10 years ago: 390.53 ppm
Last updated: May 26, 201
Up-to-date weekly average CO2 at Mauna Loa
The increase over 1 year ago is 3.30. As of this writing, there have been 2,260 such weekly readings recorded at Mauna Loa, going back to 1975. This increase is "only" the 100th highest ever recorded among all of these, placing it in the 96th percentile for "worst ever."
However it is lower than last week's figure, which was 415.39 ppm, meaning that the annual maximum has likely been reached.
In 2019, with the year not half over, 7 of the 50 highest year to year weekly average increases ever recorded have been in 2019.
In the 19 year period from April of 1975 to 1994, roughly corresponding to the 19 year period between 2001 and 2019, there were 13 readings of this type greater than 3.00 ppm. From 2001 to 2019, there have been 124 such readings.
In the 20th century these figures averaged 1.54 ppm; in the 21st, 2.13 ppm (and rising).
The value recorded last week, 415.39 ppm, was the highest weekly average reading ever reported at the Mauna Loa Observatory, significantly higher than the previous week's reading which was also a record until broken a week later.
In 2018, the peak was reached on the week ending on May 13, and was 411.85 ppm. For those who need help adding and subtracting, the difference is 3.54 ppm.
If this figure for a difference were to hold throughout the year, 2019 would represent a record breaking year by far. The record increase observed in a single year, 2015, was 3.05. For 2016 it was 2.99 ppm, the second worst year ever recorded. (It is unlikely that the annual increase will be 3.54 ppm, since the data is likely to smooth out.)
If the fact that this week's reading is 24.21 ppm higher than it was ten years ago bothers you, don't worry, be happy. You can read all about how wonderful things will be "by 2050" or "by 2100." Wind. Solar. Elon Musk. Tesla Car. And all that.
If you're even a tiny bit troubled, head on over to the E&E forum and read all about "battery breakthroughs" to store "clean energy" even if this ignores little unimportant trivialities like the 2nd law of thermodynamics, and the fact that making steel for massive wind industrial parks in former pristine wildernesses is neither clean nor, in fact, sustainable, since the amount of coal to make a kg of steel is 770 grams, roughly.
Or you can read all about wonderful perovskite solar cells laced with cesium, lead and iodine that, despite the lead, are definitely "green," since it goes without saying (or in my opinion, thinking) that anytime the word "solar" is mentioned, it requires a rote Pavlovian response of "green."
Personally as a scientist, I find the proposal to use distributed lead to make so called "distributed energy" borders on insane, but who am I to rain on a popular/populist parade? What is popular is often defined as good, logical fallacies be damned.
I repeat:
My impression that I've been hearing all about how rapidly bird and bat grinding wind turbines and magic solar cells are being installed since I began writing here in 2002, when the reading on April 21, 2002 was 375.42 ppm should not disturb you, since it is better to think everything is fine rather than focus on reality.
All this jawboning about the wonderful growth of so called "renewable energy" has had no effect on climate change, is having no effect on climate change, and won't have any effect on climate change, but it's not climate change that counts: It's all that wonderful marketing showing pictures giant sleek wind turbines on steel posts that counts.
Feel good...feel good. Say nice things. Be pleasant.
If the fact that steel is made by coking coal at high temperatures in coal fired furnaces enters your mind, I suggest you meditate and say, "OM...Om...Om...Om..." until you're only left with happy thoughts.
At the risk of repetitively asserting that reality - as opposed to cheering for our own wishful thinking - matters, though let me say again:
In this century, the solar, wind, geothermal, and tidal energy on which people so cheerfully have bet the entire planetary atmosphere, stealing the future from all future generations, grew by 8.12 exajoules to 10.63 exajoules. World energy demand in 2017 was 584.98 exajoules. Unquestionably it will be higher in 2019.
10.63 exajoules is under 2% of the world energy demand.
2018 Edition of the World Energy Outlook Table 1.1 Page 38 (I have converted MTOE in the original table to the SI unit exajoules in this text.)
According to this report, the fastest growing source of energy on the planet in the 21st century over all was coal, which grew from 2000 to 2017 by 60.25 exajoules to 157.01 exajoules.
If you think that unlike you, I am worrying and not being happy, you can always chant stuff about how "by 2050" or "by 2075" or "by 2100" we'll all live in a so called "renewable energy" nirvana powered by the sun and the wind and tooling around in Tesla electric cars.
I'll be dead "by 2050," as will most of the people doing such soothsaying about that magic year, but I'm sure that the future generation living through 2050 will all be cheering for our perspicaciousness.
Or maybe not. Maybe they won't forgive us for our wishful thinking by which we casually dumped responsibility on them to do what we were purely incompetent to do ourselves, this while we consumed every last drop of rare elements to live in our bourgeois moral hell.
We will not be forgiven, nor should we be.
I wish you a pleasant work week.
James Wishart Awarded Maria Skłodowska-Curie Medal
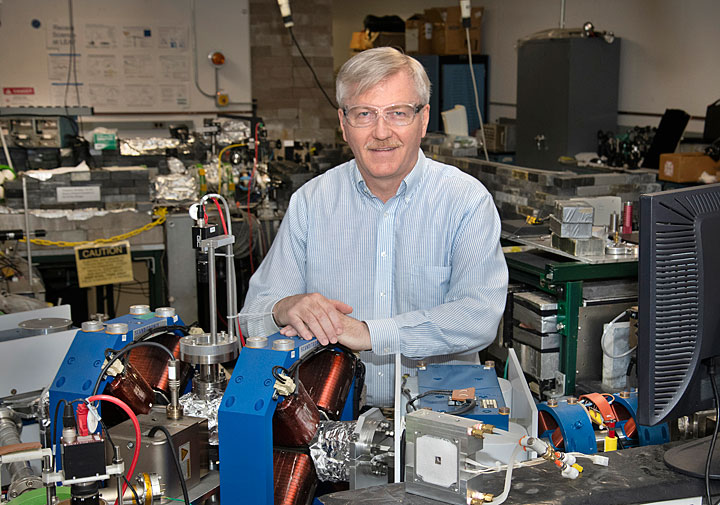
I've heard this guy speak and I follow his work rather closely, a great scientist:
“Receiving this medal is a great honor,” said Wishart, noting a legacy among radiation chemists that goes all the way back to Marie Curie. Born Maria Skłodowska in Warsaw, Poland, in 1867, Skłodowska-Curie and her husband, Pierre Curie, established the fields of radiochemistry (isolating and characterizing radioactive elements such as polonium and radium) and radiation chemistry (the study of chemical changes induced by ionizing radiation).
“Marie and Pierre Curie were the first people to report on the chemical effects of radiation, back in 1899,” Wishart noted. If radiation has high enough energy, it can knock electrons out of molecules, resulting highly reactive negatively and positively charged ions, he explained.
Nearly 100 years later, in 1998, Wishart opened the Laser Electron Accelerator Facility (LEAF), in the Chemistry Division at Brookhaven Lab. LEAF was the first photocathode electron gun accelerator in the world designed for pulse radiolysis studies....
...Wishart has served directly as a mentor to more than 60 undergraduate and graduate students at Brookhaven Lab, with many of these students returning for multiple years through programs sponsored by DOE and OEP. He was recognized as an Outstanding Mentor by the DOE Office of Science in 2006. In 2010 he received a Keeper of the Alliance Flame Award from the New York City Lewis Stokes Alliance for Minority Participation, for his contributions to increasing diversity in undergraduate research. He has participated in numerous conferences, delivering over 100 invited talks abroad, including twelve in Poland, and he has hosted collaborators, postdocs, and International Atomic Energy Agency Fellows from Poland throughout his career. His trip to Kielce to receive this award will mark his tenth visit to Poland...
...“I have also made a personal pilgrimage to special locations connected to Marie Skłodowska-Curie,” he said. “I’ve been to the Curie Museum in Paris several times, to Marie and Pierre’s final resting place in the Pantheon, and I have also been to her birthplace in Warsaw...”
...In 2018, Wishart was selected to lead a new Energy Frontier Research Center (EFRC) established at Brookhaven Lab— known as the EFRC on Molten Salts in Extreme Environments (MSEE)—to explore the properties of a class of materials composed entirely of positively and negatively charged ions that exist in the liquid state under elevated temperatures. These materials have many potential uses, including as coolants and fuels in nuclear reactors. The team led by Wishart will use specialized tools—including Brookhaven Lab’s National Synchrotron Light Source II (NSLS-II), the Chemistry Division’s ACER facilities, and the Spallation Neutron Source at Oak Ridge National Laboratory—to explore how these materials behave at extreme temperatures while exposed to intense radiation.
James Wishart Awarded Maria Skłodowska-Curie Medal
I am very proud that my youngest son will be working with some of the tools used by Wishart in his summer internship. (I hope he appreciates it.)
Wishart is a world expert in low temperature molten salts which are generally organic or partially organic, commonly known as ionic liquids.
Just a great scientist, doing great work, in obscurity, in a world of rising ignorance, right and left. If the world is to be saved, the work of men and women like Wishart will do so.
Enjoy the holiday weekend.
The Effect of Community Led Sanitation Programs in Ghana.
The paper I'll discuss in this brief post is this one: Environ. Sci. Technol.2019, 53, 9, 5466-5472 (Harter, Miriam Harter, *Jonathan Lilje, and Hans-Joachim Mosler, Environ. Sci. Technol.2019, 53, 9, 5466-5472]
I come from another time which has clearly passed, when I was born, the woman pictured in my posts was still alive, and to her, if not to us, as more "modern" liberals, those who were without mattered.
The introduction paper, especially (at least to me) what I have put in bold says something we forget as we prattle on about our consumer fantasies about our "green" cars, our LEDs showing our commitment to "efficiency" the people who mine the stuff so we can be "green" notwith standing. As the risk of being accused of paternalism by a moral superior, I reproduce it here, again, with my own bold.
Community-Led Total Sanitation (CLTS) aims at stopping open defecation by motivating participants to construct household latrines and reach high latrine coverages in target communities. This set of community-based and participatory activities has been implemented in communities worldwide by local governmental and nongovernmental institutions.(9) The goal of CLTS is to trigger a movement of change towards an improved sanitation situation.(10) This change is achieved by the commitment of all community members. In the case of Ghana, where this study is located, a community is declared open defecation free, if every single person has access to a latrine and at least 80% of the community owns a household latrine.(11) CLTS is implemented in three stages: a pre-triggering phase in which information is gathered, the triggering event that uses participatory activities to foster latrine construction, and a post-triggering phase that provides support in a series of follow-up visits.
The current literature points to the ability of CLTS to generate significant short-term reductions in open defecation as well as increases in latrine coverage and use, as well as suggestive evidence of child growth benefits in high-performing programs.(9,12?14) But its success rates vary widely across projects and countries and slippage rates as well as long-term effects have received too little scientific attention so far.(15) The success of CLTS can be measured by latrine coverage, the percentage of households within a community that have access to their own latrines. A literature review of sanitation campaigns has reported an average increase in latrine coverage following CLTS of 12%, though not statistically significant,(16) and Robinson(17) presents results of up to 96% latrine coverage in a single case in Malawi. In Ghana, where the majority of the regions have adapted CLTS as their sanitation strategy,(9) the effects are surprisingly low, with a national increase in sanitation access in recent years of only 4%,(1,18) although some specific projects in Ghana have achieved a reduction of open defecation by 19.9%.(19) The wide range in CLTS success rates raises the question how these differences can be explained.
This disturbs me all the time, that we have trillions of dollars to spend on things that don't work and won't work, and nothing to spend on the billions of people lacking basic sanitation.
In Ghana, apparently the success rates of the programs have been marginal, and so the authors explored a program where the initiation involved the community, rather than programs offered from above.
I'm not sure though, how "community oriented" it is to have Swiss visit you in Ghana:
Here's how they involved the community in any case:
Pretriggering
The community was assessed for its social structure and size, and a date for the triggering event was agreed with community leaders. They were asked to invite female and male community members from all ethnic groups to the triggering event.
Triggering
Facilitators started the session by presenting each other, an opening prayer, and welcoming community members. They facilitated the drawing of a community map on the ground with community institutions such as mosques and water sources. Then, they invited participants to locate both their houses and the spots they used for open defecation. By asking questions about possible paths of the fecal–oral transmission route, the facilitators helped participants recognize the sanitation threat that they faced in their surroundings. If participants seemed hesitant about the sanitation improvement of their community, facilitators were instructed to introduce more activities. These included the presentation of a sealed bottle of water. This was offered to participants to open and taste. A facilitator then took a stick, touched the soil with it, and then dipped it in the water. The water was then presented to participants again. This was to illustrate the contamination of water by small particles, such as those transferred by flies. Facilitators asked participants to agree on a date for the community to become open defecation free and set a community action plan in place.
Happily their did seem to be an improvement, meaning that maybe have Swiss visit you is good for you:
The authors conclude:
Apparently though, the Swiss feel that they need to keep coming back:
This is not physical science but social science, but I actually believe that irrespective of issues of paternalism or whatever, we should care about all human beings. I may be a dinosaur, but that's what I think.
Have a nice evening.
The Fate of Vanadium after the Mount Polley Mine Tailings Spill.
The paper I'll discuss in this brief post is this one: Origin and Fate of Vanadium in the Hazeltine Creek Catchment following the 2014 Mount Polley Mine Tailings Spill in British Columbia, Canada (Karen A. Hudson-Edwards et al, Environ. Sci. Technol2019, 53, 4088?4098)
I'm catching up on some reading, and actually missed or overlooked this issue of EST and came across this disaster, of which I was unaware.
Vanadium is an important alloying element used in steels, particularly high strength steels such as are used in high quality tools and, um, things like wind turbines. It is widely distributed on Earth, and is commonly found in synthetic uranium ores prepared by passing seawater over amidoxime resins, a technology designed to exploit the fact that the ocean contains about 5 billion tons of uranium as a result of the geochemical uranium cycle.
The metal exhibits a plethora of oxidation states, and has been suggested for use in "flow batteries" because batteries are often the subject of fantasies about "storing" so called "green energy" even though there is very little of said popularly imagined but endlessly hyped energy to actually store, this after half a century of wild cheering for it, and even though the 2nd law of thermodynamics irrefutably requires that the storage of energy wastes it, and finally even though betting the planetary atmosphere on massive amounts of mining is almost certainly not a good idea and is most definitely not a pro-environmental policy.
However a problem with vanadium is that in some of its common oxidation states its very toxic.
From the introduction to the paper:
Humans can be exposed to vanadium mainly through inhalation and ingestion, potentially causing long-term respiratory and digestive problems, respectively.(13) Aqueous vanadate [V(V)] can also be taken up in benthic organisms such as Hyalella azteca(14) and have been shown to cause genotoxic and cytotoxic effects in higher plants.(15) Vanadium can be distributed in water, soil, sediment, and air through the weathering of natural materials and through releases from anthropogenic activities, including the burning of fossil fuels, application of pesticides and phosphate fertilizers, steel, aerospace, and other industries, and mining.(9,16,17) For example, mining activities have led to contamination of waters and soils with V (e.g., 76–208 ?g/L in groundwaters and 149–4800 mg/kg in soils of the Panzhihua mining and smelting area in China(18,19)). There is, however, a lack of information about, and understanding of, the geochemical–mineralogical cycling of V in mining-affected environments,(20) but these are required to determine health effects and to develop management and remediation schemes...
The fourth August 2014 failure of the tailings storage facility (TSF) at Mount Polley, British Columbia, Canada, is the second largest by volume on record.(23) Approximately 25 Mm3 of material, comprising 7.3 Mm3 of tailings solids, 10.6 Mm3 of supernatant water, 6.5 Mm3 of interstitial water, and 0.6 Mm3 of tailings dam construction materials were discharged into the Quesnel River Watershed.(23?25) The material flowed north into and plugged Polley Lake and then was diverted southeast into Hazeltine Creek for 9.5 km. A significant proportion of the tailings and interstitial water (18.6 ± 1.4 M m3)(25) and eroded soils and vegetation(26) were deposited into the West Basin of Quesnel Lake (Figure 1). Deposition of tailings (average 1 m thick, but up to 3.5 m thick in the upper part of the area nearest the TSF) also occurred within the Hazeltine Creek catchment up to 100 m from the channel, especially near Polley Lake and Lower Hazeltine Creek.(25)...
In this paper, we focus on V due to its high environmental risk potential(2,8?10) and the relative lack of data on its behavior in mining-affected environments.(20) We aim to understand the geochemical cycling of V in the Hazeltine Creek catchment and its implications for the origin, transport, fate, and potentially toxicity of V in other river systems. The objectives of the study are to determine (1) V concentrations and speciation in stream, inflow, and pore waters using aqueous composition data and PHREEQC modeling, (2) solid-phase V concentrations and speciation in the deposited tailings and secondary Fe oxyhydroxides using electron microprobe, automated mineralogy analysis, and X-ray absorption spectroscopy (XAS) analysis, and (3) the environmental origin, fate, and potential hazard of the deposition of V-bearing tailings in mining-affected catchments following tailings dam failures and remediation. We present, for the first time to the best of our knowledge for natural systems, evidence that dissolution of V-bearing magnetite and titanite may contribute to aqueous V. The results will also inform restoration and management schemes for river systems receiving V from other natural and anthropogenic sources.
The authors determined the concentration of vanadium and a bunch of other elements using ICP-OES, which is not the most sensitive inorganic element analytical tool (ICP-MS) is, but is perfectly acceptable where concentrations are relatively high, and they also utilized, and in some cases an older model ICP-MS, not however an instrument with which I am familiar. Speciation was determined by coupling these detectors to an ion chromatograph.
I don't have time for all the details of this paper, but we can look at the pictures:

The caption:

The caption:

The caption:

The caption:

The caption:

The caption:
My kid knows more about this technique than I do; I'll ask him about it when he comes home again later in the summer.
Some discussion by the authors of their results:
...The significance of the Mount Polley tailings spill with respect to water quality and V transport is illustrated in Figure S4, where V flux (kilograms per year) and yield (kilograms per square kilometer per year) are compared to those of unaffected regional watersheds in British Columbia and other mining-affected watercourses around the world. The level of transport of V in the stream is elevated compared to those of nearby regional streams, even when the flux data are weighted by watershed area. In addition, under high-flow conditions, the V yield (measured at HC-9 in 2016) was comparable to (low-flow) yield values recorded in Torna Creek, Hungary, following the 2010 Ajka bauxite residue tailings spill.(71) The V transport data reported here show a departure from background concentrations and fluxes larger than the departure of those reported for Cu at Mount Polley.(37) Particulate transport of V appeared to be more dominant under high flow than low flow, suggesting physical mobilization of residual tailings could be an important transport mechanism for V during spring freshets and summer rainfall-runoff events. However, the bulk of the tailings remaining after our sampling in 2015 and 2016 was removed from the Hazeltine Creek watershed and returned to the tailings storage facility (L. Anglin, personal communication, 2018), suggesting that the effects of such physical mobilization could be minimal in the future.
Now the good news so you can not worry and be happy:
Don't worry about your Vanadium mine if you have lots of iron or titanium ores nearby.
None of this of course, implies that having a leaky vanadium flow battery in your garage would be good for you, but again, don't worry, be happy. I often hear that batteries are "green," and even though I know better, who am I to rain on the happy parade?
I hope you'll enjoy the up coming holiday weekend. I hope as well that we can all try to take a few minutes to remember a dead soldier, because that's what the holiday is supposed to be about.
Yet another new weekly record set at the Mauna Loa carbon dioxide observatory.
and what I have learned of it is to repeat it
as the dawn repeats its colors.
Cold morning to night we go,
without thought, to ourselves...
-Amiri Baraka, The Dead Poet Speaks
The epigraph came to mind because depressingly, I've been repeating myself each of the last several weeks, just changing the numbers as they get worse and worse:
Each year, the maximal value for carbon dioxide levels in the atmosphere for a particular year is observed in the Northern Hemisphere's spring. The Mauna Loa Observatory reports weekly year to year increases for each week of the current year compared to the same week in the previous year.
This year, in 2019, as is pretty much the case for the entire 21st century, these maxima represent the highest concentrations of carbon dioxide ever recorded going back to 1958, when the Mauna Loa carbon dioxide observatory first went into operation. Weekly data is available on line, however, only going back to the week of May 25, 1975, when the reading was 332.98 ppm.
Where we are now represents an all time record.
From the Mauna Loa Carbon Dioxide Observatory:
Week beginning on May 12, 2019: 415.39 ppm
Weekly value from 1 year ago: 411.84 ppm
Weekly value from 10 years ago: 390.12 ppm
Last updated: May 19, 2019
Up-to-date weekly average CO2 at Mauna Loa
The increase over 1 year ago is 3.55 ppm. As of this writing, there have been 2,259 such weekly readings recorded at Mauna Loa, going back to 1975. This increase is the 66th highest ever recorded among all of these.
In 2019, with the year not half over, 7 of the 50 highest year to year weekly average increases ever recorded have been in 2019.
The average increases over the last 4 weeks when compared to the same week in 2018 has been 3.43 ppm. For the whole of 2019, these weekly year to year increases have averaged 3.08 ppm.
In the 20th century these figures averaged 1.54 ppm; in the 21st, 2.13 ppm (and rising).
The value recorded here, 415.39 ppm, is the highest weekly average reading ever reported at the Mauna Loa Observatory, significantly higher than last weeks reading which was also a record until broken a week later..
If the fact that this reading is 25.27 ppm higher than it was ten years ago bothers you, don't worry, be happy. You can read all about how wonderful things will be "by 2050" or "by 2100." Wind. Solar. Elon Musk. Tesla Car. And all that.
If you're even a tiny bit troubled, head on over to the E&E forum and read all about "battery breakthroughs" to store "clean energy" even if this ignores little unimportant trivialities like the 2nd law of thermodynamics, and the fact that making steel for massive wind industrial parks in former pristine wildernesses is neither clean nor, in fact, sustainable.
My impression that I've been hearing all about how rapidly bird and bat grinding wind turbines are being installed since I began writing here in 2002, when the reading on April 21, 2002 was 375.42 ppm should not disturb you, since it is better to think everything is fine rather than focus on reality.
All this jawboning about the wonderful growth of so called "renewable energy" has had no effect on climate change, is having no effect on climate change, and won't have any effect on climate change, but it's not climate change that counts: It's all that wonderful marketing showing pictures giant sleek wind turbines on steel posts that counts.
Feel good...feel good. Say nice things. Be pleasant.
If the fact that steel is made by coking coal at high temperatures in coal fired furnaces enters your mind, I suggest you meditate and say, "OM...om...om...om..." until you're only left with happy thoughts.
At the risk of repetitively asserting that reality - as opposed to cheering for our own wishful thinking - matters, though let me say again:
In this century, the solar, wind, geothermal, and tidal energy on which people so cheerfully have bet the entire planetary atmosphere, stealing the future from all future generations, grew by 8.12 exajoules to 10.63 exajoules. World energy demand in 2017 was 584.98 exajoules. Unquestionably it will be higher in 2019.
10.63 exajoules is under 2% of the world energy demand.
2018 Edition of the World Energy Outlook Table 1.1 Page 38 (I have converted MTOE in the original table to the SI unit exajoules in this text.)
According to this report, the fastest growing source of energy on the planet in the 21st century over all was coal, which grew from 2000 to 2017 by 60.25 exajoules to 157.01 exajoules.
If you think that unlike you, I am worrying and not being happy, you can always chant stuff about how "by 2050" or "by 2075" or "by 2100" we'll all live in a so called "renewable energy" nirvana powered by the sun and the wind and tooling around in Tesla electric cars.
I'll be dead "by 2050," as will most of the people doing such soothsaying about that magic year, but I'm sure that the future generation living through 2050 will all be cheering for our perspicaciousness.
Or maybe not. Maybe they won't forgive us for our wishful thinking by which we casually dumped responsibility on them to do what we were purely incompetent to do ourselves, this while we consumed every last drop of rare elements to live in our bourgeois moral hell.
We will not be forgiven, nor should we be.
I wish you a pleasant work week.
Profile Information
Gender: MaleCurrent location: New Jersey
Member since: 2002
Number of posts: 33,515