NNadir
NNadir's JournalDennis Hopper Has Been Reincarnated and Has Gone to Work for the Government.
Dennis now claims to be Paul Murray, Deputy Assistant Secretary for Spent Fuel and Waste Disposition at the Department of Energy's Office of Nuclear Energy
https://www.ans.org/webinars/view-snfdoe/
I canceled my subscription to the NY Times and told them why.
It was the highly offensive lie on their front page yesterday about how fit, tall, handsome, and possessed of stamina that doddering senile, criminal, uneducated, stooped thug Trump is, along with praise for his violent, racist crowds.
I told the Times person that if I wanted propaganda, I'd watch Fox News.
An Illuminating Error in My Recent Terrifying Mauna Loa Post.
Yesterday I made a post about the data that I found terrifying at the Mauna Loa CO2 observatory, which smashed a number of records all at once.
This is that post: At the Mauna Loa CO2 Observatory, a Terrifying, Startling Week and Month, New Records Everywhere.
One of the statements in that post was this one:
This statement, in which I did something one should not do when one is handling data was "...off the top of my head..." was wrong, very wrong. My excuse is that I was pretty shaken by all the other data which is correct.
Recognizing I had done this, I went back to check myself and showed that my statement excerpted above was incorrect. In the following years, the previous year's record was surpassed during February: 1988, 1998, 2003, 2005, 2009, 2010, 2013, and 2021.
What is interesting about these years is where they rank among the worst 65 years recorded at Mauna Loa based on the average reading in that year.
1988 was the worst year on record when it was recorded; it now ranks as the 9th worst year out of 65 years of records. (An increase of 2.38 ppm over the 1987 average.)
1998 was the worst year on record when it was recorded; it now ranks as the 2nd worst year out of 65 years of records . (An increase of 2.96 ppm over the 1997 average.)
2003 ranks as the 6th worst year out of 65 years of records. (An increase of 2.53 ppm over the 2002 average.)
2005 does not rank in the top ten out of 65 years of records. (An increase of 2.28 ppm over the 2004 average.)
2009 does not rank in the top ten out of 65 years of records. (An increase of 1.81 ppm over the 2008 average.)
2010 ranks as the 5th worst year out of 65 years of records . (An increase of 2.58 ppm over the 2009 average.)
2013 ranks as the 4th worst year out of 65 years of records . (An increase of 2.68 ppm over the 2012 average.)
2021 does not rank in the top ten out of 65 years of records. (An increase of 2.21 ppm over the 2004 average.)
In the worst year ever recorded, 2016, an increase of 3.40 ppm over the 2015 average, the previous year's record was not recorded in February.
It was recorded in January.
Only one other year thus far has passed the previous year's record in January.
That year is 2024.
The new record was set in first in the week beginning January 28, 2024, 422.28 ppm. It was surpassed the very next week, the most recent week recorded as of this writing, that of the week beginning February 4, 2024, which reported an astounding, shocking and terrifying 425.83 ppm, blowing all previous records out of the water by an unprecedented amount. The data was, by the way, corrected on data review at the Mauna Loa Observatory, an increase of 0.01 ppm from that reported in my previous post linked above. All other remarks in that post are correct.
If the trend holds, which it did not do in 2021, 2009 and 2005 by making it into the "top ten," we are in for a hell of a year in accumulations of the dangerous fossil fuel waste CO2 in 2024, a hell of a year.
Unbelievable, utterly unbelievable, were it not for the truth that it is real.
Have fun on Super Bowl evening. I think I'll have a drink.
History will not forgive us, nor should it.
I gave a heart to someone I used to have on my ignore list.
People change, often for the better.
At the Mauna Loa CO2 Observatory, a Terrifying, Startling Week and Month, New Records Everywhere.
Let me preface my standard Mauna Loa Observatory commentary and language by saying that I am totally shocked by what went on in the data reported there. I have never seen anything like it, and I've been monitoring this data for many years.
My mind is blown; it's nothing sort of horrible.
The standard commentary I use in these posts:
Facts matter.
When writing these depressing repeating posts about new records being set, reminiscent, over the years, to the ticking of a clock at a deathwatch, I often repeat some of the language from a previous post on this awful series, as I am doing here with some modifications. It saves time.
A recent post of this nature is here: At the Mauna Loa CO2 Observatory, 2024 Starts With a Fairly Disgusting Bang.
As I've been reporting over the years in various contexts, the concentrations of the dangerous fossil fuel waste carbon dioxide which is killing the planet fluctuate sinusoidally over the year, with the rough sine wave superimposed on a quadratic axis:

Monthly Average Mauna Loa CO2
The Observatory posts on its data pages curated and reviewed averages for daily, weekly, monthly, and annual data. I maintain spreadsheets for the latter three to use in calculations.
Let me stop here, to repeat, In all the years I've been doing this I have NEVER seen anything like this, multiple records shattered in the same week.
Let's being with the weekly data:
Week beginning on February 04, 2024: 425.82 ppm
Weekly value from 1 year ago: 420.08 ppm
Weekly value from 10 years ago: 398.18 ppm
Last updated: February 10, 2024
Weekly average CO2 at Mauna Loa
Let's look at what is record setting here: First and foremost. 425.82 ppm is the highest value ever reported at Mauna Loa for the concentration of the dangerous fossil fuel waste carbon dioxide in the planetary atmosphere. Given the sinusoidal nature - the highest reading recorded in a year typically is observed in April or May, rarely in early June - *the previous year's record is generally surpassed in March, occasionally in April. It has NEVER been passed in February.*
Another record established in the week to week increase over the same week of the year before, in this case. There have been 2505 points of this type recorded going back to 1975. The global average going back to 1975 for all 2505 weeks reported is 1.87 ppm increases. In the 21st century, that average is 2.20 ppm increases for all weeks in the 21st century.
This week's increase, from week 5 of 2023 to week 5 is an astounding 5.74 ppm, the greatest such week to week comparison between consecutive years ever record, by far, the (now) 2nd worst ever having occurred in week beginning July 31, 2016, when the increase was 5.01 ppm, making one of only two to exceed a 5.00 ppm increase.
The observatory does not record days for which data review fails quality control. All four data points making this week's data average under this curation are in the top 10, unsurprisingly, for highest ever daily readings. The highest daily reading ever recorded is now that recorded on February 7, 2024, 426.40 ppm; followed by February 4, 2024, 426.21 ppm; followed by February 5, 2024, 425.96 ppm; and February 8. 2024, 425.43 ppm. Five of the highest daily readings occurred in 2024, still a young year, and the other 5 in 2023.
These numbers are astounding.
For monthly data, January 2024 was the second worst monthly average for any of the 65 January months recorded at Mauna Loa, 3.33 ppm higher than the average for January of 2023.
Of the top fifty increases recorded out of the 2505 data points for any week compared with the same week of the previous year, 40 have taken place in this century, 33 in the last 10 years, and 13 in the last 5 years. Of the 10 data points in the top 50 that took place in the 20th century, six occurred in 1998, when the rain forests in S.E. Asia caught fire after slash and burn fires set to make palm oil plantations for "renewable biodiesel" for Germany's "Renewable Energy Portfolio" went out of control during a drought. There is no telling whether the Chilean and Australian fires in the Southern Hemisphere summer are playing a role as dramatic as the rain forest fires of 1998. Other feedback loops may be operating.
(With this reading, the reading for the week beginning August 28, 2022 (3.71 ppm increase over the same week of 2021) fell out of the top 50. Of the ten readings in the 20th century, five, including two from 1998, fall between the 41st and 50th worst.)
As for the ten year data, 27.64 difference from the same week in 2014, is the highest ten year comparator ever, the next highest, being 26.53 ppm higher in a week in 2021 than the same week of 2011.
Fourty-eight of the top 50 comparators have taken place during or after 2020; two others in 2019.
In the Northern Hemisphere this coming summer, what hasn't burned already, will burn. You can count on it.
By the way, this morning I attended a lecture by a clueless professor at Princeton University, Jesse Jenkins, this lecture:
Science on Saturday: The Pathway to Achieve a Net-zero Economy in the U.S. by 2050 (Jesse Jenkins)
It was all about how solar and wind will save us, attached to money, money, money, money with complete indifference to environmental issues. He claimed that emissions have "leveled off," because of solar and wind and gas, the same line of shit that Socolow and Pacala were handing out in 2004, twenty years ago, when the concentration of carbon dioxide in the fifth week when the concentration of the dangerous fossil fuel waste carbon dioxide was 377.88 ppm.
Something's going on, and what that "something is, is not "leveling off." Things are getting worse faster. How exactly can an "expert" be so disconnected with reality?
Maybe he wants to be the next Amory Lovins, a clueless bourgeois soothsayer who never checks his assumptions but chants them endlessly, no matter how much of his half a century of this soothsaying has proved and will continue to prove nonsensically disconnected from reality. To Professor Jenkins credit, he tried not to throw up when nuclear energy was mentioned. This is new in the Princeton academic community, where the conversation is all about nuclear wars that don't happen, and so called "nuclear waste" that has yet to kill anybody. Professor Jenkins to his also to his (more marginal) credit stated that so called "nuclear waste" can be contained indefinitely, but seemed not to understand what it actually it is, a tremendous future resource. The only other thing he correctly stated is that electrolysis is thermodynamically inefficient, producing the accurate number of about 50% efficiency, but really, he had to be prodded to mention the existence of the laws thermodynamics.
Be very suspicious of anyone, even a professor at a swell University, who talks about energy without putting thermodynamics on the front burner.
It was all cheering for solar, wind, batteries and hydrogen, pure thermodynamic nonsense.
Sorry kids, chanting doesn't work and there aren't enough cobalt slaves for all those batteries we'll need to keep our little bourgeois fantasies running along like the Duracell bunny.
Here we are, the planet on fire, some kind of atmospheric catastrophe staring in our face, and still all this happy talk. It's like prayer was in bubonic plague.
Disgusting.
My heart is breaking. Fortunately, in the academic world, there are people who can grasp reality. None of them have a shot at joining the Andlinger Center at Princeton University though.
Have a nice weekend.
Note: The statement now bolded and between asterisks is incorrect.
The correction has been described here: An Illuminating Error in My Recent Terrifying Mauna Loa Post.
A 1959 Comment on Engineering Education
Hyman Rickover, Education and Freedom, 1959
It's possible we do better now, on the other hand, the engineers of the 1960's through the year say, 1990, did remarkable things.
Stabilizing 3D Printing of Metallic Titanium Alloys.
The paper I'll discuss in this post is this one: Jingqi Zhang, Michael J. Bermingham, Joseph Otte, Yingang Liu, Ziyong Hou, Nan Yang, Yu Yin, Mohamad Bayat, Weikang Lin, Xiaoxu Huang, David H. StJohn, Matthew S. Dargusch;
Ultrauniform, strong, and ductile 3Dprinted titanium alloy through bifunctional alloy design Science 383 6683 639-645 2024.
I referred my son to this article this morning, telling him that maybe he was being "scooped" in his research program; on reflection, I was wrong, same game, different stadium. The nice thing about being a father is that one is allowed to annoy one's children with unsolicited advice leading them to roll their eyes.
It may be wise to consider the related "perspectives" comment in the same issue of Science, the current issue.
This is here:
Stabilizing 3D-printed metal alloys
Subtitle:
Lai-Chang Zhang AND Jincheng Wang, Science 8 Feb 2024, Vol 383, Issue 6683 pp. 586-587.
From the "perspectives:"
In the layer-by-layer 3D printing process (typically with a high cooling rate of approximately 103 to 108 K/s), a substantial thermal gradient forms near the edge and bottom of the melt pool, where metal powder has been melted by a laser beam. The thermal gradient induces epitaxial grain growth along the interface between the freshly melted material and the underlying solid material, with grains growing toward the melt pool center. Cycles of heating and partial remelting during the printing of multiple layers ultimately results in the formation of large columnar grains and heterogeneously distributed phases, both of which are undesirable because they can lead to nonuniform (anisotropic) and compromised mechanical properties (2, 3).
Titanium alloys are among the strongest metallic materials. In engineering applications at ambient temperature, a suitable titanium alloy typically exhibits a tensile elongation (the maximum stretch or deformation that a material can withstand before breaking) ranging from ?10 to ?25%, which reflects good material reliability. Although greater elongation (ductility) facilitates easier formability and holds priority in certain applications, an increased strength within this elongation range is preferred for enduring mechanical loads. In both conventional and additive manufacturing techniques for processing metallic materials, a trade-off between strength and ductility has been prevalent (4, 5).
From the full paper:
A further complication is that many allotropic alloy systems, including titanium alloys, are also susceptible to the heterogeneous distribution of phases associated with the solid-state thermal cycling experienced during the 3D printing process (19–22). This poses an additional challenge to achieve uniform mechanical properties of 3D-printed parts made from these alloys (23, 24). The localized heating, cooling, and reheating nature of 3D printing effectively creates dynamic in situ heat treatments that encourage the decomposition of initially formed phases and/or the precipitation of new phases through solid-state phase transformations (20, 25). Because thermal cycles are spatially variable, the associated heat treatments can produce an inhomogeneous distribution of phase along the building direction of the part, thereby resulting in the spatial variation of mechanical properties (21, 22). Postprinting heat treatments can be effective in mitigating these phase heterogeneities but introduce delays and additional costs and are not effective in refining textured columnar grains (26). The confluence of these issues has made it extremely challenging to achieve uniform and superior mechanical properties in the as-fabricated state.
We demonstrate a design strategy to address this challenge by simultaneously controlling the grain structure and constituent phases in products manufactured by laser powder bed fusion (L-PBF). We selected the Ti?5Al?5Mo?5V?3Cr (Ti-5553) metastable ? titanium alloy as a model alloy because it shows the coexistence of coarse columnar ? grains and a heterogeneous distribution of phases (Fig. 1, A to C). This results in highly nonuniform, position-dependent tensile properties from L-PBF, as we demonstrate (Fig. 1, D and E) and as has been demonstrated in other studies across multiple 3D printing technologies (27–29). We show that the single addition (up to 5.0 wt %) of elements from the ?-isomorphous group [in this case, we selected Mo; see section on alloy design in the materials and methods (30)] into Ti-5553 powder to form a composite blend achieves bifunctionality: (i) During 3D printing, some of the Mo particles partially melt, but the core survives to nucleate fine grains during solidification and prevent coarse columnar grains from forming...
A graphic from the full paper:

The caption:
(A) The coexistence of coarse columnar ? grains and spatially dependent phases in Ti-5553 produced by L-PBF. (1) Schematic illustration of the L-PBF process. (2) EBSD IPF map showing coarse columnar ? grains along the building direction (BD). (3) SEM-BSE micrographs showing the phase distribution along the BD. The yellow arrows point out ? phases with a darker contrast in the ?-Ti matrix. (B) Schematic illustration of the microstructure heterogeneity in terms of columnar ? grains and heterogeneously distributed phases on the cross-section S?S (the yz-plane), as indicated in (A). (C) TEM micrographs of Ti-5553. (1) Dark-field TEM image showing ? phases. (2) TEM SAED pattern from the [111]? zone axis showing the presence of ? phases. The key diagram of the diffraction is shown in (3). Note that there are three ? variants with the same zone axis of (2110), which grow in different directions. (4) TEM SAED from the [113]? zone axis showing the existence of isothermal ? phases. The key diagram of the diffraction is shown in (5). Note that there are two ? variants. (D) Tensile engineering stress-strain curves of Ti-5553 horizontal tensile specimens (1, 3, 5, 7, 9, and 11). The inset shows how the horizontal tensile specimens were machined from the Ti-5553 part. (E) Tensile engineering stress-strain curves of Ti-5553 vertical tensile specimens (1, 3, 5, 7, 9, and 11). The inset shows how the vertical tensile specimens were machined from the Ti-5553 part.
Here is a video that I've put up several times in this space showing the 3D printing of nuclear reactor cores:
In the period between 2024, and 2040, an additional 110 million people will die from antinukism, the mechanism being...
...air pollution. Between 2024 and 2040 an additional 70 million will die, by the same mechanism, from the idiotic paranoia sold to the general public by antinukism, in addition to the 90 million million who have already died since 2011 during which antinukes have been whining on computers about Fukushima, computers overwhelmingly powered by fossil fuel derived electricity.
These numbers do not include the deaths antinukes have brought, are bringing and will bring to us from climate change.
Let's make something clear, OK? I could no more prove to a member of the antinuke cults that nuclear power is "safe" than I could prove to a dumb shit Trumper antivaxxer that vaccines are "safe." Vaccines are not risk free, and neither is nuclear power, but vaccines save lives. Nuclear power need not be without risk to save lives any more than vaccines need to be risk free to save lives.
And nuclear power quantitatively saves lives, as described by one of the world's most prominent climate scientists:
Prevented Mortality and Greenhouse Gas Emissions from Historical and Projected Nuclear Power (Pushker A. Kharecha* and James E. Hansen Environ. Sci. Technol., 2013, 47 (9), pp 4889–4895)
It follows,that antinuke rhetoric kills people.
Predictably, antinukes when asked to show that as many people have died from radiation released at Fukushima as will die from air pollution in the next hour, 800 deaths, as a result of antinuke selective attention, they don't answer with numbers if they answer at all.
I gave something called a "reference" with numbers for the death toll killed every year in my previous post to one of the world's most prominent medical journals, Lancet to show the death toll associated with antinuke ignorance. Of course, apparently, antinukes can read no better than they can think.
Billions of dollars are being squandered to "clean up" Fukushima, but to what standard? Is the standard required to show to the satisfaction of antinuke paranoids who fail to understand even the lowest level standards of risk. There is no satisfying the members of this cult.
How many lives will be saved by these billions of dollars spent to "clean up" Fukushima? As many as if we ignored bourgeois assholes who think that the existence of radioactivity is a great tragedy, and did nothing to "clean up" Fukushima and instead spent the same number of billions of dollars to provide basic sanitation to the 1.5 billion people who lack access to even basic sanitation?
Six hundred thousand people, mostly children will die this year from fecal waste?
What is the mechanism by which this allegedly "molten" reactor core will kill anyone if nothing is done for to address it? Six hundred thousand per year, every year, as is the case from the water poverty about which antinukes couldn't give a shit?
Seven million per year every year, as is the case from air pollution?
As many as died in 2023 from extreme heat?
I once confronted an "I'm not an antinuke" antinuke who whined stupidly that a tunnel collapsed at the Hanford Nuclear Reservation, and thus stupidly insisted nuclear energy is "too dangerous."
This led me, to my great amusement, to compose a rather long post filled with something called "references" to the primary scientific literature, to explore the mechanisms of radionuclide migration: 828 Underground Nuclear Tests, Plutonium Migration in Nevada, Dunning, Kruger, Strawmen, and Tunnels.
Of course, antinukes can't read any more than they can think, so the exercise was for my amusement only, but happily, I learned a lot writing it.
I once heard here from someone, a dumb shit straight up antinuke as opposed to an "I'm not an antinuke" antinuke, that he, she them or it was a "data scientist" and indicated that he, she, them or it was sure that her, his, their, or it's resume was better than mine, this while being unable to produce numbers for the death toll associated with radiation released from Fukushima. This person, doesn't know anything at all about me, and I am disinterested in anything about the person in question except for the position of a foil to call out the mentality.
A "data scientist" who cannot produce numbers to support an argument, admittedly a stupid argument, but one that a competent data scientist would not make without numbers, isn't worth shit as a "data scientist." No one should hire such a fool, and no one should work with such a fool, period.
I note that the same asshole didn't give a flying fuck about how many people are killed by tsunami's because they live in coastal cities by seawater. The number of antinukes calling for the phase out of coastal cities because of tsunamis have killed over a hundred of thousand people in them in this century, both in 2004 and again in 2011 (also destroying reactors) is zero, just like the number of antinukes calling for the phase out of fossil fuels is zero.
In fact, antinukes are engaged in making coastal cities even more unsafe than they are now. It's called "climate change."
What happens when I ask anyone here or elsewhere to show that radiation releases in the last 13 years from Fukushima have killed as many people as air pollution will kill in the next hour, 800 people, they change the subject. If I ask these same salespeople selling death and destruction to show that in the nearly 70 year history of commercial nuclear power it has killed as many people who die every damned day from air pollution, yesterday, today, tomorrow, next Thursday, December 25, 2024 and if things don't change on January 1st 2040, 19,000 deaths each day roughly, they also change the subject, slime away into their deadly little holes or simply disappear.
Antinukes are equivalent to antivaxxers, although antivaxxers have not come close to killing 19,000 people per day, every day, year after year, decade after decade.
Antinukes have no sense of decency, no intellectual integrity, no moral integrity, no serious knowledge, and not a single care about the future of humanity beyond their stupid paranoia that a few radioactives might tunnel into their rather useless brains.
People lie, to themselves and each other, but numbers don't lie. Anyone who is serious about any argument about safety should be able to produce numbers. If they can't do so, they, and their claims are worthless at best, deadly toxic at worst,
Have a wonderful Friday and enjoy the upcoming weekend.
"Win a heart" science contest. Explain the difference between Faradaic efficiency and Thermodynamic efficiency.
This could be a short thread since it should be easy to get one or more of four DU hearts I have to give away. Alternatively it could be a short thread because no one is interested in it.
Unlike the rules set by the trivia person over in the Lounge, you are free to use Google to tell us what the difference between Faradaic efficiency and thermodynamic efficiency is in electrolysis. The first correct answer gets a heart from me. Upon the award of the heart, that part is closed with two parts to remain.
In scientific papers discussing approaches to making electrolysis to produce hydrogen economically viable - which it isn't - so we can all pretend in spite of reality that hydrogen is "green," - people often speak of "Faradaic Efficiency." (The numbers often seem impressive.) Faradaic efficiency is different however from "Thermodynamic efficiency," the latter being what antinuke Guru Amory Lovins told us, in 1976, would save the world, except it didn't. (He was apparently confused when he opened a physics text and assumed that no one else on the planet knew physics so he could claim he did.)
The consequence of thermodynamics has resulted in this industrial reality, to which I often point:
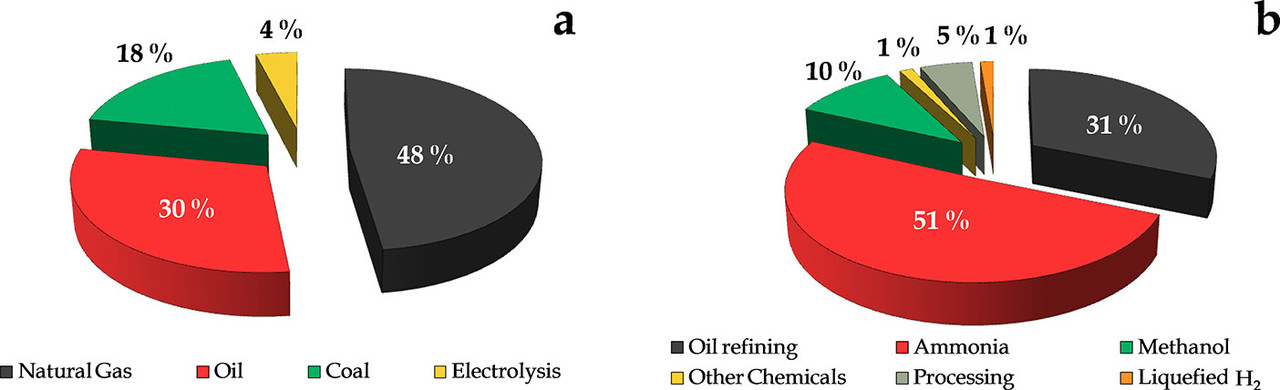
The caption:
Progress on Catalyst Development for the Steam Reforming of Biomass and Waste Plastics Pyrolysis Volatiles: A Review Laura Santamaria, Gartzen Lopez, Enara Fernandez, Maria Cortazar, Aitor Arregi, Martin Olazar, and Javier Bilbao, Energy & Fuels 2021 35 (21), 17051-17084]
You may also win a heart for producing here the equation that describes the thermodynamics of electrolysis.
You may win two hearts for showing, with a simple example, how this equation applies to the electrolysis of water to make hydrogen and oxygen, with brief satisfactory text on the implications, thus demonstrating why electrolysis, despite the efforts of fossil fuel salespeople and salesbots here and elsewhere to claim dishonestly otherwise, electrolysis is an economic nonstarter industrially and hydrogen production is dominated by fossil fuel dependence.
There will only be one award in each category.
Unfortunately, I am the judge of the contest as well as the person with hearts to give away, for what it's worth.
I disabused my son of a reason he gave for thinking Leonardo DiCaprio is a good actor.
My son is upstairs watching "The Wolf of Wall Street," a movie I've never seen and don't want to see, but it was on when I walked in the room. I have passing familiarity with the movie from osmosis, so I knew what movie it was.
My son is fond of the famous chart showing that Leonardo DiCaprio never dates women over the age of 25:

He said, referring to Margot Robbie that DiCaprio was a great actor because he was pretending to be interested in a woman over 25.
I regretted that I had to tell him that the movie was made in 2013, and Margot Robbie was 23 then.
Better luck next time, son, trying to prove that dubious point...
Profile Information
Gender: MaleCurrent location: New Jersey
Member since: 2002
Number of posts: 33,574