2016 Postmortem
Related: About this forumIpsos, IBD-TIPP,Rand allwent up for us yesterday.
Ipsos and Rand both updated their friday numbers to some degree (ipsos replaced half their friday respondents with morning contacts), Rand replaced all their friday respondents. So maybe friday was an especially bad day. Interesting to see if Gallup and Ras follow suit today.
This may be indicative of a larger trend. I'm trying to work on an algorithm not to calculate the probabilities of particular values, but one that bootstraps on the historical data to quantify the probability of daily shifts.
It would represent a better idea of momentum.
If I get this to work, I'll post the graphics here.
Keep Calm and Do the Statistics.
 = new reply since forum marked as read
Highlight:
NoneDon't highlight anything
5 newestHighlight 5 most recent replies
= new reply since forum marked as read
Highlight:
NoneDon't highlight anything
5 newestHighlight 5 most recent replies

TroyD
(4,551 posts)It wil be interesting to see what you find.
Shivering Jemmy
(900 posts)before my kids all wake up. And type in the results for the last week (most of these pollsters don't post excel spreadsheets of their daily numbers)
So don't hold your breath on this being done in a timely manner.
Mario_Ordinario
(16 posts)59.6% chance to win
http://www.intrade.com/v4/markets/contract/?contractId=743474
Cosmocat
(14,564 posts)he was low 60s yesterday.
Gotta halt the Romney momentum and swing it back toward O.
Shivering Jemmy
(900 posts)anybody want to do that for me?
Democratopia
(552 posts)Shivering Jemmy
(900 posts)equally likely a bad day (friday after debate) rolled off.
no way to assess causality. Could calculate granger causality between big news events and poll changes, but very small sample and subjective.
TroyD
(4,551 posts)And right now Romney is +1.
So we definitely need that trend to change - and fast.
Shivering Jemmy
(900 posts)the probability distributions from 2008 don't figure into the point of this post.

ProSense
(116,464 posts)the polls are currently being skewed by plethora of RW and fly-by-night polls (http://www.democraticunderground.com/10021530460). Others, including Gallup and Reuters (http://www.democraticunderground.com/1251138192), show no real movement.
As for a comparison to 2008 (and remember the dynamics were completely different), leads that translated into wins are now seen as close because people are comparing them to the winning margin and not the poll margins. The poll margins showed a completely different picture. Note for example OH and WI.
by kos
The current numbers are from the TPM polling composite. The four-year-ago numbers are from exactly four years ago, or Oct. 3, 2008. The final '08 margin—a new column on this chart—is the final vote results.
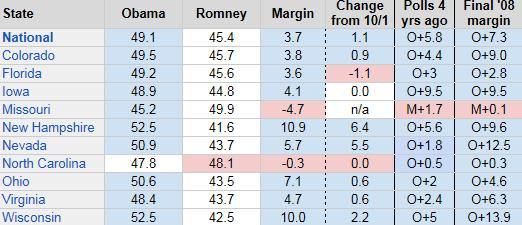
As some of you might quickly notice, Missouri is back on the chart! That 4.7-point Romney advantage feels big and difficult to overcome, right? Well, Romney faces equally daunting or bigger deficits in five of the remaining contested states. No one really thinks Missouri will turn Blue this year, and no one is spending money on the presidential race. So the fact that it is closer than states that Romney is spending millions in is pretty darn hilarious.
It also gives Romney another state in which he's above the 45s—one of just two in this list of 10 states plus the national composite.
North Carolina, by the way, was a slight Obama lead yesterday in the composite, until a new Rasmussen poll this morning turned it Red again. As it's pretty obvious at this point, the state will come down to GOTV.
Every time I plug new numbers into this chart for this feature, I think, "Lookit that, Romney is going backwards again!" I decided to see if my perception was reality, so I compared Romney's level of support in the polling composite to what he was receiving a little over a month ago:
- more -
http://www.dailykos.com/story/2012/10/03/1139351/-Battleground-polling-snapshot-Romney-regresses
writes3000
(4,734 posts)It's like clockwork. The first two positive threads I opened this morning had him doing his best to refute, question and remind people that "things are so bad right now".
It's beyond tedious and very obvious.
Democratopia
(552 posts)Shivering Jemmy
(900 posts)and removing gallup from the mix because there was no change...
we have IBD-TIPP up
Rand up
ipsos up
Ras down
Using the followin z score equation:
z = (k - np) / sqrt(n p (1-p))
We have n = 4 now.
So for those for polls the z score of an upswing is
(3-0.5*4)/sqrt(4*0.5(1-0.5))
(3-0.5*4)=1. which amounts to a Pz=1 in 6 chance of this pattern
However, since 2 of these polls use rounding there is a finite chance of no change. But only for IBD and Ipsos, which round to nearest 1. But lets ignore that for the time being because I'm tired.
Putting Gallup back into the mix, the probability that is wouldn't have changed is ~ 1/100, but since the numbers really stay within a very narrow band (47-50) 1/4 is a more conservative guess.
So the overall estimated probability of this configuration of data is fairly low. could be around Pz(Gallup Up) + Pz(Gallup down) + Pz(Gallup No Change) ~ 1/6*(3/8) + 1/6(3/8) + 1/6(1/4)=3/48 + 3/48 + 2/48 = 8/48, still 1/6.
Not a significant number, but not very likely either.
Better algorithm once I all polls report and I get some coding peace.
writes3000
(4,734 posts)Statisticians and those who can analyze trends to that degree.
Thanks for doing some extra work and daring to be positive.
Unfortunately, this place has become infested with people with darker motives.
still_one
(92,190 posts)better it gets