Welcome to DU!
The truly grassroots left-of-center political community where regular people, not algorithms, drive the discussions and set the standards.
Join the community:
Create a free account
Support DU (and get rid of ads!):
Become a Star Member
Latest Breaking News
General Discussion
The DU Lounge
All Forums
Issue Forums
Culture Forums
Alliance Forums
Region Forums
Support Forums
Help & Search
Environment & Energy
Related: About this forumNSIDC - June 2015 Arctic Sea Ice 3rd Lowest Extent On Record
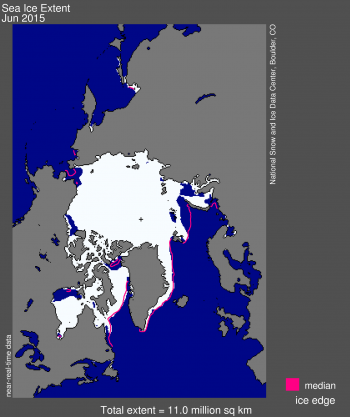
Figure 1. Arctic sea ice extent for June 2015 was 11.0 million square kilometers (4.24 million square miles). The magenta line shows the 1981 to 2010 median extent for that month. The black cross indicates the geographic North Pole. Sea Ice Index data.
Arctic sea ice extent for June 2015 averaged 11.0 million square kilometers (4.24 million square miles), the third lowest June extent in the satellite record. This is 920,000 square kilometers (355,200 square miles) below the 1981 to 2010 long-term average of 11.89 million square kilometers (4.59 million square miles) and 150,000 square kilometers (58,000 square miles) above the record low for the month observed in 2010.
Ice extent remains below average in the Barents Sea as well as in the Chukchi Sea, continuing the pattern seen in May. While extent is below average in western Hudson Bay, it is above average in the eastern part of the bay and near average east of Greenland.
Ice loss typically quickens in June with the largest loss rate occurring in July, the warmest month of the year. A total of 1.61 million square kilometers (622,000 square miles) of ice was lost through the month, slightly slower than the 1981 to 2010 average rate of decline of 1.69 million square kilometers (653,000 square miles). By the end of the month, ice extent for the Arctic tracked within one standard deviation of the 1981 to 2010.
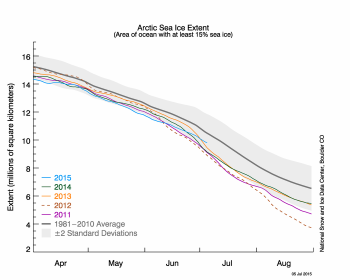
Figure 2a. The graph above shows Arctic sea ice extent as of July 5, 2015, along with daily ice extent data for four previous years. 2015 is shown in blue, 2014 in green, 2013 in orange, 2012 in brown, and 2011 in purple. The 1981 to 2010 average is in dark gray. The gray area around the average line shows the two standard deviation range of the data. Sea Ice Index data.
Conditions in context
June 2015 was fairly warm in the Arctic. Air temperatures at the 925 millibar level (about 3,000 feet above the surface) were above average over much of the Arctic Ocean, notably in the Kara Sea (2 to 5 degrees Celsius or 4 to 9 degrees Fahrenheit above average) and in the East Siberian Sea (2 to 3 degrees Celsius or 4 to 5 degrees Fahrenheit above average).
The especially warm conditions in the Kara Sea, where ice extent is below average, is consistent with a wind pattern tending to bring in warm air from the south. The wind flows along the northern flank of a low-pressure area centered over the Barents Sea. Northerly winds on the western side of this low-pressure area brought cool conditions to the Norwegian Sea. Temperatures in the northern and eastern Beaufort Sea and much of the Canadian Arctic Archipelago were near or slightly below average.
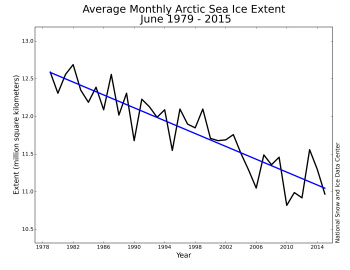
Figure 3. Monthly June ice extent for 1979 to 2015 shows a decline of 3.6% per decade relative to the 1981 to 2010 average.
Arctic sea ice extent averaged for June 2015 was the third lowest in the satellite record. Through 2015, the linear rate of decline for June extent is 3.6 % per decade.
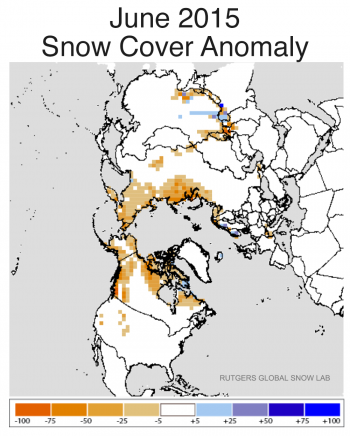
Figure 4a. This snow cover anomaly map shows how snow cover for June 2015 differs from the average snow cover for June from 1981 to 2010. Areas in orange and red indicate lower than average snow cover, while regions in blue had more snow than average.
Northern Hemisphere snow cover
June snow cover for the Northern Hemisphere averaged 5.45 million square kilometers (2.10 million square miles), the second lowest of the 48-year record. This ranking also holds for June snow cover assessed for North America at 4.09 million square kilometers (1.58 million square miles) and Eurasia at 1.36 million square kilometers (525,000 square miles).
June snow cover was especially low over Alaska and western Canada. This is in part related to last winter’s unusual jet stream pattern, discussed in our March post. The pattern brought unusually warm conditions to the region and promoted low sea ice extent to the Bering Sea and Sea of Okhotsk. Recall that the restart of the Iditarod Race had to be moved from Anchorage to Fairbanks because of poor snow conditions in the Alaska Range. This spring has also been warm and dry in Alaska. These conditions have contributed to a large number of lightning-induced wildfires in the state.
EDIT
http://nsidc.org/arcticseaicenews/
InfoView thread info, including edit history
TrashPut this thread in your Trash Can (My DU » Trash Can)
BookmarkAdd this thread to your Bookmarks (My DU » Bookmarks)
0 replies, 543 views
ShareGet links to this post and/or share on social media
AlertAlert this post for a rule violation
PowersThere are no powers you can use on this post
EditCannot edit other people's posts
ReplyReply to this post
EditCannot edit other people's posts
Rec (6)
ReplyReply to this post