In June, Arctic Ice Loss 2nd-Fastest In Satellite Record; For July, Melt Rate Up 21% Over Average
Arctic sea ice extent continued a rapid retreat through the first two weeks of July as a high pressure cell moved over the central Arctic Ocean, bringing higher temperatures. Antarctic sea ice extent increased rapidly through June and early July, and reached new daily record highs through most of this year.
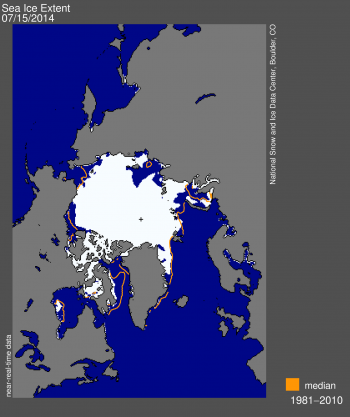
Figure 1. Arctic sea ice extent for July 15, 2014 was 8.33 million square kilometers (3.22 million square miles). The orange line shows the 1981 to 2010 average extent for that month. The black cross indicates the geographic North Pole. Sea Ice Index data. About the data
During the second half of June, the rate of sea ice loss in the Arctic was the second fastest in the satellite data record. As a result, by the beginning of July extent fell very close to two standard deviations below the long-term (1981 to 2010) average.
The rate of ice loss for the first half of July averaged 104,000 square kilometers (40,000 square miles) per day, 21% faster than the long-term average for this period.
Ice loss during the first two weeks of July 2014 was dominated by retreat within the Laptev Sea, and within the Kara and Beaufort seas. Open water areas now exist north of 80 degrees North in the Laptev Sea. Ice cover remains fairly extensive in the Beaufort and Kara seas compared to recent summers.
By July 15, ice extent had fallen to within 440,000 square kilometers (170,000 square miles) of that seen in 2012 (the modern satellite-era record minimum) on the same date, and was 1.54 million square kilometers (595,000 square miles) below the 1981 to 2010 average. However, ice concentration remains high within the central Arctic Ocean, particularly compared to 2012.
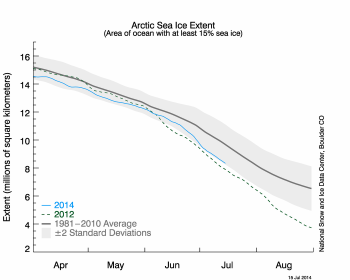
Figure 2. The graph above shows Arctic sea ice extent as of July 15, 2014, along with daily ice extent data for 2012, the record low year. The gray area around the average line shows the two standard deviation range of the data. Sea Ice Index data.
The first half of July 2014 was dominated by anomalously high sea level pressure over the Arctic Ocean and the Barents Sea, coupled with below-average sea level pressure over Iceland. Air temperatures at the 925 millibar level (or about 2,500 feet above the surface) were mostly 1 to 3 degrees Celsius (2 to 5 degrees Fahrenheit) above average over parts of the Arctic Ocean, leading to surface melting. Air temperatures were 1 to 3 degrees Celsius (2 to 5 degrees Fahrenheit) below average in the Kara and Barents seas, where melt has generally been off to a slower start than average this summer. Ice extent remains below average in the Laptev and East Greenland seas and Baffin Bay, and is near average to locally below average in the Beaufort, Chukchi and Kara seas.
EDIT
http://nsidc.org/arcticseaicenews/