Environment & Energy
Related: About this forum2nd most extreme March jet stream pattern on record extends winter
One measure of how contorted the jet stream has become is by measuring the difference in pressure between the Icelandic Low and the Azores High. There are two indices used to do this--one called the Arctic Oscillation (AO), which treats the flow over the entire Northern Hemisphere, and another called the North Atlantic Oscillation (NAO), which is more focused on the North Atlantic. The two are closely related about 90% of the time. When these indices are strongly negative, the pressure difference between the Icelandic Low and the Azores High is low. This results in a weaker jet stream, allowing it to take large, meandering loops, letting cold air to spill far to the south from the Arctic into the mid-latitudes.
The AO index hit -5.2 today (March 20). This is the second most extreme March value of the index since record keeping began in 1948; only an AO value of -6.3 in March 1970 was more extreme. We've had some wildly variable jet stream patterns in recent years in the Northern Hemisphere. Just last year, we had the opposite extreme in March, when our ridiculous "Summer in March" heat wave brought a week of temperatures in the 80s to the Midwest U.S. The first day of spring today in Chicago, IL is expected to have a high temperature of just 25°F--a 60 degree difference from last year's high of 85°F on March 20!
...
Unusual jet stream contortions in winter have become increasingly common in recent years, according to a March 2013 paper by Tang et al., "Cold winter extremes in northern continents linked to Arctic sea ice loss". They found a mathematical relationship between wintertime Arctic sea ice loss and the increase in unusual jet stream patterns capable of bringing cold, snowy weather to the Eastern U.S., Western Europe, and East Asia, typical of what one sees during a strongly negative Arctic Oscillation. They theorized that sea ice loss in the Arctic promotes more evaporation, resulting in earlier snowfall in Siberia and other Arctic lands. The earlier snow insulates the soil, allowing the land to cool more rapidly. This results in a southwards shift of the jet stream and builds higher atmospheric pressures farther to the south, which increases the odds of cold spells and blocking high pressure systems that can cause extended periods of unusually cold and snowy weather in the mid-latitudes.
http://www.wunderground.com/blog/JeffMasters/comment.html?entrynum=2370
 = new reply since forum marked as read
Highlight:
NoneDon't highlight anything
5 newestHighlight 5 most recent replies
= new reply since forum marked as read
Highlight:
NoneDon't highlight anything
5 newestHighlight 5 most recent replies
Scuba
(53,475 posts)
John1956PA
(2,656 posts)The article is interesting. Thanks for posting it.

Kurovski
(34,655 posts)Where'd he get his science degree anyway?
John1956PA
(2,656 posts)LOL at your post.
Seriously, Groundhog Day this year occurred on a Saturday which happened to present reasonable weather conditions. Therefore, a record crowd was on hand. The Punxsutawney community benefits from the influx of visitors, and the organizers of the event did not want to send the crowd away on a down note. Those individuals who are serious about weather forecasts, and who took time to read up on the prevailing weather pattern, knew that winter weather was likely going to continue for several weeks following Groundhog Day. However, not many individuals were, or are, in favor of this prolonged invasion of arctic air deep into the contiguous 48 states.
Nonetheless, visitors to Punxsutawney on February 2 in coming years will continue to give the Groundhog Day organizers a pass regarding any prediction which proves to be errant.
Kurovski
(34,655 posts)I will continue to believe phat little Phil when desperation and Winter delirium requires it of me.

mopinko
(70,225 posts)last year we were in the middle of a bunch of 80º days.
Demeter
(85,373 posts)I may have to burn the parka if it ever gets warm enough to remove it.

2naSalit
(86,794 posts)Last edited Fri Mar 22, 2013, 01:34 AM - Edit history (1)
to agree. also, see this:
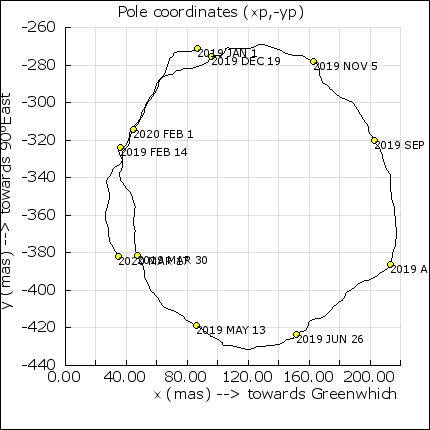
found at: http://solarimg.org/artis/
What is interesting about the plot chart is that, I started looking at this a couple months after the 2011 Japan/tsunami earthquake event, the "wobble" is consistently altered over the past two years. This chart was updated in January this year, 2011 data was removed but it looked essentially like this current version. If the 2011 data weren't removed, you would see an outer ring of plot points forming a shape that looks like a "pigtail" spiral. So if you can picture this image with that outer ring of data points, it wold indicate that the seasons are off by several weeks dependent upon location as to the effects. In the northern Rockies last year the migratory birds and wildflowers were showing up six weeks earlier than normal (from just two years prior). In Portland, OR area, the migratory birds and flowers were up to six weeks late. The red winged blackbirds have been arriving here long before the snow and ice are gone and the arctic birds are heading north already this year.
The sun now shines in my north facing windows for about 14 weeks, it never shone in those windows prior to 2010, the equinox solar position is not "true" E/W any longer, the Solstice positions are extreme compared to a couple years ago and all years prior. Also, the Ursa Major (Big Dipper) constellation is now several degrees north of where it was two years ago throughout the year. My Latitudinal position is approximately 45 degrees North. OOPS had to edit longitudinal for latitudinal! I've been having a strange day and I got all confused...