Environment & Energy
Related: About this forumSomething interesting happened to the carbon intensity of the world's electricity supply
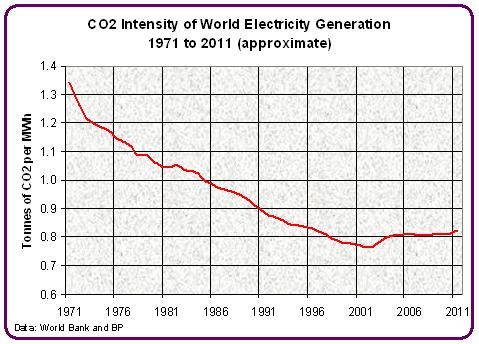
I created the above graph by dividing the amount of electricity generated in the world by an estimate of the amount of CO2 produced by the coal and natural gas used to generate it. The electricity from all other sources is counted in and is assumed to be carbon-neutral. I assumed that all the coal and 40% of the NG consumed in the world is used to generate electricity.
For 30 years from 1971 to 2001 the carbon intensity of the global electricity supply improved by about 1.5% per year. Then in 2002 that trend abruptly stopped. The improvements in the previous 3 decades can presumably be attributed to improved generation efficiency, the increased use of gas in preference to coal, and the increased share of carbon neutral sources such as hydro, nuclear and wind.
I wonder what explains the sudden halt at the beginning of the century? I'm betting it's a combination of the halt to nuclear development, a slowdown in hydro buildout, and a swing back towards coal. Does anyone have any other ideas?
The thing that got me thinking about this was reading about Pacala and Socolow's stabilization wedgies again. A "wedgie of wind" should introduce an intensity improvement similar to what we see here from 1970 to 2000. But the situation since 2000 does not seem to bode well for that possibility (nor for the other efficiency or CCS wedgies either).
 = new reply since forum marked as read
Highlight:
NoneDon't highlight anything
5 newestHighlight 5 most recent replies
= new reply since forum marked as read
Highlight:
NoneDon't highlight anything
5 newestHighlight 5 most recent replies
OnlinePoker
(5,722 posts)China isn't building items only for export anymore. Much of their product is now going for domestic consumers and all of the new electrical and petroleum based items wanted by 1.2 billion people is calling for a massive increase in power requirements. They are building new coal plants all over the place and I'm sure this is where the majority of the increase is coming from. India, too is building up their power plants all over the country as they fight to keep up with demand.

phantom power
(25,966 posts)They weren't the only ones.
GliderGuider
(21,088 posts)AverageJoe90
(10,745 posts)
global1
(25,253 posts)
CRH
(1,553 posts)is used in electricity generation include the volume of coking coal? Steel production increase in China has also inflated overall coal production stats.
GliderGuider
(21,088 posts)Also, it would only have an impact on the numbers if the ratio of coking coal to generation coal changed significantly over time. Since coking coal looks like it constitutes only 10 to 15 percent of total world coal production, I don't think it would make that much difference. I'm more concerned about my assumption that 40% of NG is used for electricity. I couldn't find a global estimate for that in the time I spent googling, but the US is somewhat lower than that.
I'm thinking of taking a run at Pacala and Solow, so this was my first look at the numbers from that point of view. The main thing I was looking for was any evidence that GHG-neutral energy sources are displacing FF's. They have in the past (at least nuclear and hydro), but it doesn't look like they are doing so today. I expect wind and solar to be additional sources rather displacement sources at the global scale, at least until we hit Peak Coal - which won't be for quite a while yet unfortunately.
CRH
(1,553 posts)at least on an industrial level. There are over a 140 years of global reserves at present usage, so peak would be well into the future.
NoOneMan
(4,795 posts)and reverse climate change. IOW, put up windmills and save the earth while growing the economy.
Firstly, we may be plateauing on this metric (mostly because the cheap, dirty fuel is awesome for third world industrialization). Secondly, during the time of decline, we know what has happened to atmospheric carbon levels.
Creating more energy (green or not) simply guarantees energy is cheaper, fueling growth that demands further increases in energy. The actual average carbon intensity of energy is less important than the overall consumption level of energy. Cleaner energy in one part of the globe just means the shunned dirty energy will be used elsewhere
GliderGuider
(21,088 posts)One is CO2, the other is human activity. Both are bad for the planet. My argument against hypothetical "Mr. Fusion" solutions like Polywell (and even electric cars) is that they address only the CO2 side of the page, leaving the "activity problem" intact or even letting us do more at lower cost.
AverageJoe90
(10,745 posts)We can't keep using fossil fuels and coal without risking a climate disaster.

muriel_volestrangler
(101,322 posts)it was used more than gas in 1971, and is still significant:
http://www.iea.org/stats/pdf_graphs/29ELEC.pdf
GliderGuider
(21,088 posts)I used selected years of your IEA data generation. I used carbon intensities of 1040 g/KWh for coal, 880 g/KWh for oil and 620 g/KWh for gas that I got from Tables 2, 3 and 4 in this paper. Here is the chart that came out:
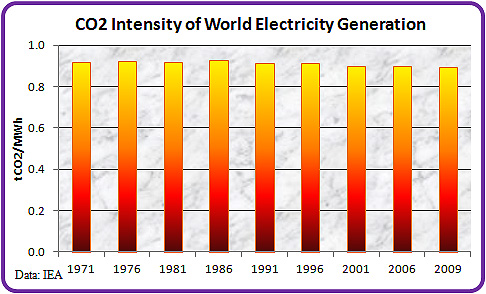
It pays to dig into the numbers a little deeper - adding in oil made all those "interesting" trends vanish. According to this calculation, the globally averaged carbon intensity of electricity may have improved less than 3% in the last 40 years.
Thanks for the IEA graph.
CRH
(1,553 posts)The future can't depend on electricity as a clean source as long as any FF is used in production.
Either a break through is needed in how FF's are converted to energy, or a break through is needed in clean renewable production capacities and storage. Living and possibly transportation might be possible with clean energy, but not industry as it presently functions.

Odin2005
(53,521 posts)
wtmusic
(39,166 posts)"In 2003, 1687 MW of capacity were installed leading up to a lapse of the PTC in 2004. In 2004, only 400 MW of capacity were installed in the United States. With the PTC reinstated in 2005, 2431 MW of capacity were installed which was a record at the time for the United States.[32] The PTC allowed for the United States to lead the world in wind power additions in 2005 and 2006 with 16% of the worldwide capacity being installed in 2006 coming from the United States.[31] The planning and permitting process for wind energy can take up to two years. With short-term extensions of the PTC, big investments from companies for research and development are less likely to occur.[32] The current trend of short-term extensions of the Production Tax Credit have led to a boom and bust cycle of short-term planning and low number of investments. As the PTC expires many investors hurry to finish projects thus producing smaller capacity installations and creating higher electricity costs.[35] Longer term Production Tax Credit policy would stimulate low-cost wind development and establish a more stable policy for wind development. Having short-term extensions on the PTC can potentially slow wind development, raise costs, require a greater reliance on foreign manufacturing, produce transmission issues, and most importantly can reduce the amount of research and development of wind energy.[31] The world energy council has estimated that new wind capacity worldwide will amount to $150 to $ 400 billion in new business over the next twenty years.[36]
http://en.wikipedia.org/wiki/United_States_Wind_Energy_Policy
GliderGuider
(21,088 posts)Last edited Sat Nov 3, 2012, 09:32 PM - Edit history (2)
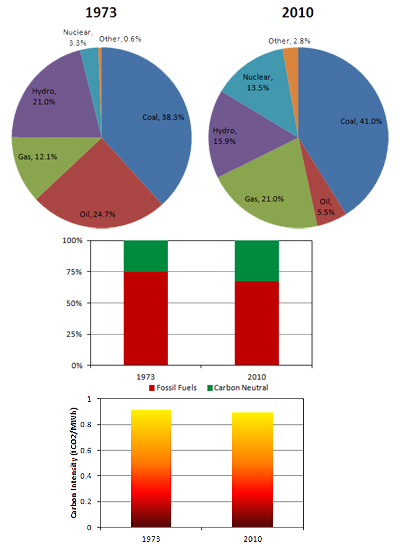
I think this will be my last look at this. The electricity data is from the IEA. The amount of CO2 produced by each fossil fuel is from the University of Wisconsin paper I referenced above.
The generation mix, as shown in the pie charts has changed significantly since 1973. The second graph shows that the proportion of electricity produced from fossil fuels has dropped almost 8%. But as the bottom graph shows, the overall CO2 intensity of the world's electricity has declined by only 2.4%.
This is bad news for environmental activists, especially those working to move humanity towards the use of "clean energy".