Environment & Energy
Related: About this forumArctic And Antarctic Sea Ice Level Hit Simultaneous Record Lows - 8 Standard Deviations Out
There are weather and climate records, and then there are truly exceptional events that leave all others in the dust. Such has been the case across Earth’s high latitudes during this last quarter of 2016, on track to be the planet’s warmest year on record. Sea ice extent and area have both plummeted to record lows for this time of year in both the Arctic and Antarctic. Such dramatic losses rarely occur at the same time, which means that the global total of sea ice coverage is phenomenally low for this time of year. The weirdness extends to midlatitudes: North America as well as the Arctic have been bathed in unusual mildness over the last several weeks, while Eurasia deals with a vast zone of above-average snowfall and below-average temperatures. Let’s look at each of these to see what’s up and where they may (or may not) be related.
 ?w=480
Figure 1. Global sea ice area, including both Arctic and Antarctic. Sea ice extent is typically larger than sea ice area because it includes all data cells with at least 15 percent ice coverage (see NSIDC definitions). Global sea ice extent is experiencing a similar departure from average as global sea ice area. Experts usually analyze Arctic and Antarctic sea ice separately rather than together (see discussion below). Image credit: Wipneus, using data from National Snow and Ice Data Center. (NSIDC was not involved in producing this image.)
 ?w=480
Figure 2. The normalized value of global sea ice area as of November 17, 2016, was so far from any other total in the 37-year record that it represented a departure of about 8 standard deviations below the average! Image credit: Wipneus, using data from National Snow and Ice Data Center. (NSIDC was not involved in producing this image.)
 ?w=480
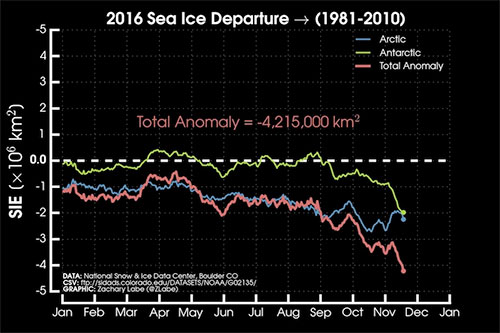
Figure 3. Departures from the 1981-2010 average for sea ice extent, in millions of square kilometers, across the Arctic (blue) and Antarctic (green) in the year 2016 through November 17. The departures from average were almost equally large by mid-November, leading to a total global sea ice extent of more than 4.2 million sq km below average. Image credit: Zachary Labe, based on data from the National Snow and Ice Data Center. (NSIDC was not involved in producing this image.)
Round-the-clock darkness usually forces a rapid growth in sea ice across the Arctic by November, but that process has been much slower than normal over the past month or so. There is now far less mid-November sea ice in the Arctic than in any other year since satellite records began in 1979. For the five-day average ending November 17, the difference in Arctic sea ice extent between this year and the next-lowest year (2012) was 582,000 square kilometers, an area about a third larger than California. It’s an especially dramatic example of the long-term decline in sea ice across the Arctic that’s been evident for upwards of 20 years.
EDIT
Henson again:
Experts agree that the laggard sea ice this month around Antarctica is a separate matter from the Arctic, because sea ice in the northern and southern polar regions is produced by two markedly different circulation regimes and geographies. “At NSIDC, we generally frown on the practice of looking at the global sea ice extent,” said Mark Serreze, director of the National Snow and Ice Data Center, “the reason being that ice in the two hemispheres tends to behave rather differently; while Arctic extent shows clear downward trends in all months, the pattern for the Antarctic has been much more complex.” Serreze and several other ice experts I contacted agreed that there was no obvious explanation for why sea ice extent would suddenly dip in unison in both the Arctic and Antarctic when the two processes are typically so uncorrelated. Previous record-warm years didn’t behave this way. Could some previously dormant or absent connection be popping up just now? If so, it’s not an obvious one. NSIDC’s Ted Scambos: “I’d say that to link the two poles with a single causality chain at the seasonal/annual level is probably about a decade of research in the future.”
EDIT
nlike the Arctic, sea ice extent around Antarctica has actually shown a slight increasing trend over the last couple of decades. This might seem odd in a global climate that’s warming, but there are several plausible explanations, as we discussed in an October 26 post. Just two years ago, in September 2014, Antarctic sea ice extent hit the highest values observed at any time of the year since monitoring began in 1979. We’re now seeing the lowest values on record for mid-November, and the margin between this year and all other years has been increasing. For the five-day average ending November 17, the difference in Antarctic sea ice extent between this year and the next-lowest year (1986) was an enormous 1.12 million square kilometers.
EDIT
https://climatecrocks.com/2016/11/20/arctic-antarctic-ice-in-free-fall/#comments
 = new reply since forum marked as read
Highlight:
NoneDon't highlight anything
5 newestHighlight 5 most recent replies
= new reply since forum marked as read
Highlight:
NoneDon't highlight anything
5 newestHighlight 5 most recent replies

Canoe52
(2,948 posts)

OKIsItJustMe
(19,938 posts)hatrack
(59,587 posts)Oops.
Table near the bottom: odds of one in 1 X 10 to the 15th.
http://www.aleph.se/andart/archives/2009/09/ten_sigma_numerics_and_finance.html
OKIsItJustMe
(19,938 posts)I actually cannot conceive of something which is eight standard deviations away from the norm.
It’s like… I have a tough time picturing 1,000 anything. I wind up playing little mental games, like picturing a stack of 50 one dollar bills, and then imagining 20 of them in 5 rows of 4. (OK, but that’s really just imagining 20 things or maybe 5, not 1,000.)