Welcome to DU!
The truly grassroots left-of-center political community where regular people, not algorithms, drive the discussions and set the standards.
Join the community:
Create a free account
Support DU (and get rid of ads!):
Become a Star Member
Latest Breaking News
General Discussion
The DU Lounge
All Forums
Issue Forums
Culture Forums
Alliance Forums
Region Forums
Support Forums
Help & Search
Environment & Energy
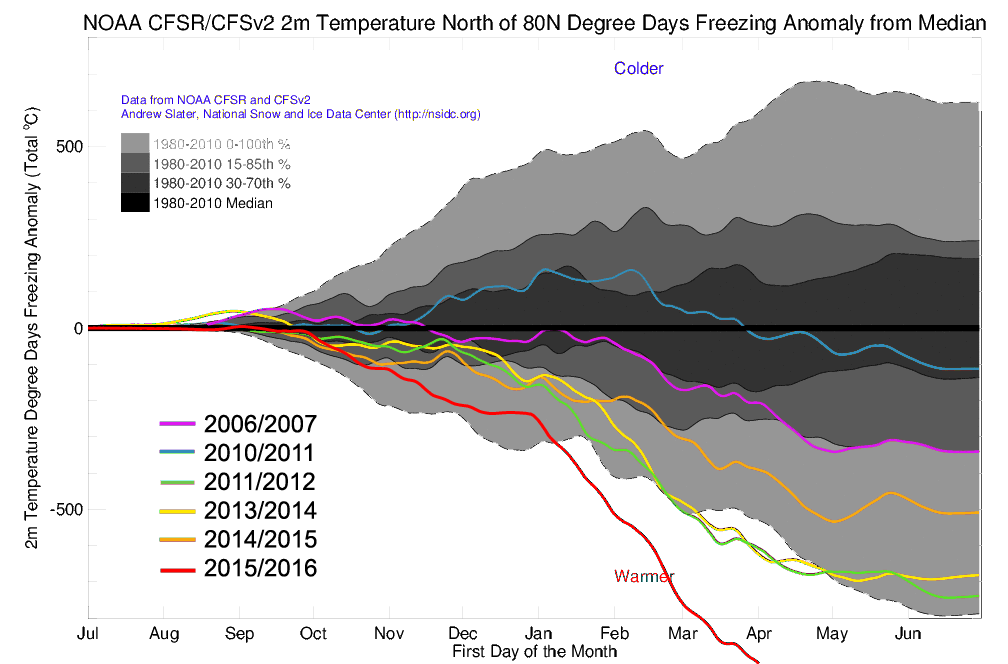
Related: About this forumThe number of Arctic Freezing Degree Days is absolutely collapsing
Explanations and discussion here:
https://nsidc.org/cryosphere/seaice/processes/thermodynamic_growth.html
http://neven1.typepad.com/blog/2016/04/winter-analysis-addendum.html
InfoView thread info, including edit history
TrashPut this thread in your Trash Can (My DU » Trash Can)
BookmarkAdd this thread to your Bookmarks (My DU » Bookmarks)
7 replies, 874 views
ShareGet links to this post and/or share on social media
AlertAlert this post for a rule violation
PowersThere are no powers you can use on this post
EditCannot edit other people's posts
ReplyReply to this post
EditCannot edit other people's posts
Rec (14)
ReplyReply to this post
7 replies
 = new reply since forum marked as read
Highlight:
NoneDon't highlight anything
5 newestHighlight 5 most recent replies
= new reply since forum marked as read
Highlight:
NoneDon't highlight anything
5 newestHighlight 5 most recent replies
= new reply since forum marked as read
Highlight:
NoneDon't highlight anything
5 newestHighlight 5 most recent replies
The number of Arctic Freezing Degree Days is absolutely collapsing (Original Post)
GliderGuider
Apr 2016
OP

iemitsu
(3,888 posts)1. Not good.
I was born in Alaska, many years ago, and the glaciers that I remember as a kid are all melted.
No one there denies climate change.

yourpaljoey
(2,166 posts)2. wow
OnlinePoker
(5,722 posts)3. I use DMI for this info and it's showing the same thing.
You can go all the way back to 1958 and so far, 2016 has been the most consistently above average temperature year to date above the 80th parallel.
http://ocean.dmi.dk/arctic/meant80n.uk.php

Canoe52
(2,948 posts)4. Thanks for the
Link to DMI, I had never been to their website before, lots of good info!

Really good info...
muriel_volestrangler
(101,322 posts)5. Andrew Slater's regularly updated graph for this is here:
http://cires1.colorado.edu/~aslater/ARCTIC_TAIR/index_80_t2m.html
It's nearly at -1000 by now:

There's also a graph of the absolute numbers - it's reach about 4500, when the median for this time of year is about 5500.
It's nearly at -1000 by now:
There's also a graph of the absolute numbers - it's reach about 4500, when the median for this time of year is about 5500.
NickB79
(19,253 posts)6. We're gonna need a bigger chart. nt