Economy adds 1.4 million jobs in August, and the unemployment rate fell below 10 percent
Source: Washington Post
The U.S. economy added 1.4 million jobs in August, sending the unemployment rate below 10 percent for the first time since the pandemic began, a glimmer of good news as the pandemic continues its march across the country. The unemployment rate fell to 8.4 percent.
Analysts had expected job gains of around that amount, as the economy has shown signs of rebounding from the economic carnage left by closures aimed to stem the spread of the coronavirus.
The report is likely to influence the political debate about whether to reauthorize more aid for businesses and the unemployed, when Congress returns from its recess this month. It could also play a central role in the presidential race.
Economists say that they are still concerned about the job market's long term prospects because of the expiration if some of the aid programs passed by Congress in the Spring.
Read more: https://www.washingtonpost.com/business/2020/09/04/economy-adds-14-million-jobs-august-unemployment-rate-fell-below-10-percent-first-time-since-pandemic-took-hold/
Full headline: Economy adds 1.4 million jobs in August, and the unemployment rate fell below 10 percent for the first time since the pandemic took hold
Stay tuned for the BLS stats!

Original article -
September 4, 2020 at 8:34 a.m. EDT
The unemployment rate fell to 8.4 percent. The improvement in the August jobs report is good news for the economy, which has been showing signs of a rebound from the recession that began with business closures aimed at slowing the spread of the coronavirus.
This is a developing story. It will be updated.
ETA - their updates now include a graph -

 = new reply since forum marked as read
Highlight:
NoneDon't highlight anything
5 newestHighlight 5 most recent replies
= new reply since forum marked as read
Highlight:
NoneDon't highlight anything
5 newestHighlight 5 most recent replies

mahatmakanejeeves
(57,495 posts)I'll edit this later.
Nonfarm payroll employment rises by 1.4 million in August; unemployment rate falls to 8.4%
Employment Situation Summary
Transmission of material in this news release is embargoed until 8:30 a.m. (ET) Friday, September 4, 2020
Technical information:
Household data: cpsinfo@bls.gov * www.bls.gov/cps
Establishment data: cesinfo@bls.gov * www.bls.gov/ces
Media contact: (202) 691-5902 * PressOffice@bls.gov
THE EMPLOYMENT SITUATION -- AUGUST 2020
Total nonfarm payroll employment rose by 1.4 million in August, and the unemployment rate fell to 8.4 percent, the U.S. Bureau of Labor Statistics reported today. These improvements in the labor market reflect the continued resumption of economic activity that had been curtailed due to the coronavirus (COVID-19) pandemic and efforts to contain it. In August, an increase in government employment largely reflected temporary hiring for the 2020 Census. Notable job gains also occurred in retail trade, in professional and business services, in leisure and hospitality, and in education and health services.
This news release presents statistics from two monthly surveys. The household survey measures labor force status, including unemployment, by demographic characteristics. The establishment survey measures nonfarm employment, hours, and earnings by industry. For more information about the concepts and statistical methodology used in these two surveys, see the Technical Note.
Household Survey Data
In August, the unemployment rate declined by 1.8 percentage points to 8.4 percent, and the number of unemployed persons fell by 2.8 million to 13.6 million. Both measures have declined for 4 consecutive months but are higher than in February, by 4.9 percentage points and 7.8 million, respectively. (See table A-1. For more information about how the household survey and its measures were affected by the coronavirus pandemic, see the box note at the end of this news release.)
Among the major worker groups, the unemployment rates declined in August for adult men (8.0 percent), adult women (8.4 percent), teenagers (16.1 percent), Whites (7.3 percent), Blacks (13.0 percent), and Hispanics (10.5 percent). The jobless rate for Asians (10.7 percent) changed little over the month. (See tables A-1, A-2, and A-3.)
{snip}
_____________
The Employment Situation for September is scheduled to be released on Friday, October 2, 2020,
at 8:30 a.m. (ET).
_______________________________________________________________________________________________
Coronavirus (COVID-19) Impact on August 2020 Establishment and Household Survey Data
Data collection for both surveys was affected by the coronavirus (COVID-19) pandemic. In the
establishment survey, approximately one-fifth of the establishments are assigned to four
regional data collection centers for collection. Although these centers were closed,
interviewers at these centers worked remotely to collect data by telephone. Additionally, BLS
encouraged businesses to report electronically. The collection rate for the establishment
survey was 77 percent in August, higher than the average for the 12 months ending in February
2020. The household survey is generally conducted through in-person and telephone interviews.
However, for the safety of both interviewers and respondents, the vast majority of interviews
were done by telephone, with in-person interviews conducted on a limited basis in some areas
of the country. The household survey response rate was 70 percent in August, up from the low
of 65 percent in June but well below the average rate of 83 percent for the 12 months prior
to the pandemic.
In the establishment survey, workers who are paid by their employer for all or any part of
the pay period including the 12th of the month are counted as employed, even if they were not
actually at their jobs. Workers who are temporarily or permanently absent from their jobs and
are not being paid are not counted as employed, even if they are continuing to receive
benefits.
In the household survey, individuals are classified as employed, unemployed, or not in the
labor force based on their answers to a series of questions about their activities during the
survey reference week (August 9th through August 15th). Workers who indicate they were not
working during the entire survey reference week and expect to be recalled to their jobs
should be classified as unemployed on temporary layoff. As in recent months, a large number
of persons were classified as unemployed on temporary layoff in August.
Since March, household survey interviewers have been instructed to classify employed persons
absent from work due to temporary, coronavirus-related business closures or cutbacks as
unemployed on temporary layoff. BLS and Census Bureau analyses of the underlying data suggest
there still may be some workers affected by the pandemic who should have been classified as
unemployed on temporary layoff. However, the share of responses that may have been
misclassified was much smaller in July and August than in prior months.
For March through July, BLS published an estimate of what the unemployment rate would have
been had misclassified workers been included. Repeating this same approach, the overall
August unemployment rate would have been 0.7 percentage point higher than reported. However,
this represents the upper bound of our estimate of misclassification and probably overstates
the size of the misclassification error.
According to usual practice, the data from the household survey are accepted as recorded. To
maintain data integrity, no ad hoc actions are taken to reclassify survey responses.
More information is available at
www.bls.gov/covid19/employment-situation-covid19-faq-august-2020.htm.
_______________________________________________________________________________________________
Employment Situation Summary Table A. Household data, seasonally adjusted
Employment Situation Summary Table B. Establishment data, seasonally adjusted
Employment Situation Frequently Asked Questions
Employment Situation Technical Note
Table A-1. Employment status of the civilian population by sex and age
Table A-2. Employment status of the civilian population by race, sex, and age
Table A-3. Employment status of the Hispanic or Latino population by sex and age
Table A-4. Employment status of the civilian population 25 years and over by educational attainment
Table A-5. Employment status of the civilian population 18 years and over by veteran status, period of service, and sex, not seasonally adjusted
Table A-6. Employment status of the civilian population by sex, age, and disability status, not seasonally adjusted
Table A-7. Employment status of the civilian population by nativity and sex, not seasonally adjusted
Table A-8. Employed persons by class of worker and part-time status
Table A-9. Selected employment indicators
Table A-10. Selected unemployment indicators, seasonally adjusted
Table A-11. Unemployed persons by reason for unemployment
Table A-12. Unemployed persons by duration of unemployment
Table A-13. Employed and unemployed persons by occupation, not seasonally adjusted
Table A-14. Unemployed persons by industry and class of worker, not seasonally adjusted
Table A-15. Alternative measures of labor underutilization
Table A-16. Persons not in the labor force and multiple jobholders by sex, not seasonally adjusted
Table B-1. Employees on nonfarm payrolls by industry sector and selected industry detail
Table B-2. Average weekly hours and overtime of all employees on private nonfarm payrolls by industry sector, seasonally adjusted
Table B-3. Average hourly and weekly earnings of all employees on private nonfarm payrolls by industry sector, seasonally adjusted
Table B-4. Indexes of aggregate weekly hours and payrolls for all employees on private nonfarm payrolls by industry sector, seasonally adjusted
Table B-5. Employment of women on nonfarm payrolls by industry sector, seasonally adjusted
Table B-6. Employment of production and nonsupervisory employees on private nonfarm payrolls by industry sector, seasonally adjusted(1)
Table B-7. Average weekly hours and overtime of production and nonsupervisory employees on private nonfarm payrolls by industry sector, seasonally adjusted(1)
Table B-8. Average hourly and weekly earnings of production and nonsupervisory employees on private nonfarm payrolls by industry sector, seasonally adjusted(1)
Table B-9. Indexes of aggregate weekly hours and payrolls for production and nonsupervisory employees on private nonfarm payrolls by industry sector, seasonally adjusted(1)
Access to historical data for the "A" tables of the Employment Situation News Release
Access to historical data for the "B" tables of the Employment Situation News Release
HTML version of the entire news release
The PDF version of the news release
News release charts
Supplemental Files Table of Contents
Table of Contents
Last Modified Date: September 04, 2020

BumRushDaShow
(129,106 posts)I think I'm about ready for a cup of Wawa coffee (K-cup style). 
TGIF!
mahatmakanejeeves
(57,495 posts)BumRushDaShow
(129,106 posts)to force your computer to get the most recent page off the server vs from your cache! 
still_one
(92,219 posts)were at a slower rate
Also, what isn’t included is the continuing layoffs that have been occurring in some sectors
The census jobs will end in late September, and depending on other areas of the economy in hiring, along with the control of the Pandemic, may not be fully realized until November

George II
(67,782 posts)...last week, and about 1 million each of the previous three weeks.
So we have 1.4 million "new" jobs and 3.8 million lost jobs in August. What a booming economy, eh?
still_one
(92,219 posts)
FBaggins
(26,748 posts)This isn't a "how many people were hired last month?" figure. It's a change in the total number of jobs.
So if there were 3.8 million jobs reported lost during the month... then there were 5 million jobs added (for a net of 1.2 million).

progree
(10,909 posts)# Nonfarm Employment (Establishment Survey, https://data.bls.gov/timeseries/CES0000000001
1st 8 months of the year, in thousands
2020: 152212 152463 151090 130303 133028 137809 139543 140914
So from July to August it went from 139.543 million jobs to 140.914 million jobs
but still 11.549 million below the February level.
. . . . Monthly changes: https://data.bls.gov/timeseries/CES0000000001?output_view=net_1mth
progree
(10,909 posts)George II
(67,782 posts)....1.4 million people returned to jobs vacated when they were laid off earlier this year.
BumRushDaShow
(129,106 posts)nowadays... 
onetexan
(13,043 posts)BumRushDaShow
(129,106 posts)(unfortunately also resulting in big spikes of coronavirus). However there are certain sectors (like the airline and hospitality industry) that have either already started or are on the precipice of big layoffs. Much of the "drop" had been due to the various funding laws that went into effect (e.g., "Paycheck Protection Act" ) to get people back on the rolls. Whether that subsidizing of jobs continues is up in the air at this point.
George II
(67,782 posts)
exactly what I’ve been thinking the last three months. Many of these jobs are ones people are going back to. Sure some are people getting new jobs, but majority are people going back to the job they were furloughed from. I also thought I heard the job numbers for July were revised down. Anyone hear that? Thought it was NPR.
BumRushDaShow
(129,106 posts)here - https://www.democraticunderground.com/10142575568#post1
the previous months' revisions are included in the full report -
+4,791,000 to +4,781,000, and the change for July was revised down by 29,000, from +1,763,000
to +1,734,000. With these revisions, employment in June and July combined was 39,000 less than
previously reported. (Monthly revisions result from additional reports received from businesses
and government agencies since the last published estimates and from the recalculation of
seasonal factors.)
https://www.bls.gov/news.release/empsit.nr0.htm
Of course the "X Factor" includes this -
absent from work due to temporary, coronavirus-related business closures or cutbacks as
unemployed on temporary layoff. BLS and Census Bureau analyses of the underlying data suggest
there still may be some workers affected by the pandemic who should have been classified as
unemployed on temporary layoff. However, the share of responses that may have been
misclassified was much smaller in July and August than in prior months.
For March through July, BLS published an estimate of what the unemployment rate would have
been had misclassified workers been included. Repeating this same approach, the overall
August unemployment rate would have been 0.7 percentage point higher than reported. However,
this represents the upper bound of our estimate of misclassification and probably overstates
the size of the misclassification error.

jayfish
(10,039 posts)How does adding only 1.4M jobs drop the unemployment rate by 1.6%? ...sounds fishy to me.
mahatmakanejeeves
(57,495 posts)progree
(10,909 posts)The unemployment rate comes from the Household Survey
and the payroll jobs numbers comes from the Establishment Survey. They often widely diverge, and the household survey is much more volatile and lower accuracy.
# Monthly changes for Non-farm payroll employment from the Establishment Survey, thousands
https://data.bls.gov/timeseries/CES0000000001?output_view=net_1mth
2018: 121 406 176 137 278 219 136 244 80 201 134 182
2019: 269 1 147 210 85 182 194 207 208 185 261 184
2020: 214 251 -1373 -20787 2725 4781 1734 1371
Feb and March of 2020 are Corrected. July and August are Preliminary. In thousands
(Yup, that's a "1" in February 2019, meaning only 1,000 net jobs created that month ... I had to look at it again)
# Employed in thousands from the separate Household Survey, Monthly changes:
http://data.bls.gov/timeseries/LNS12000000?output_view=net_1mth
2018: 509 656 49 133 341 85 243 -392 431 450 146 197
2019: -198 239 -125 -45 148 304 198 549 403 246 -8 267
2020: -89 45 -2987 -22369 3839 4940 1350 3756
Jan and Feb of each year are affected by changes in population controls. In thousands
So for August 2020, the nonfarm payroll jobs number increased by 1,371,000 while the "Employed" (Household Survey) increased by a much much larger 3,756,000.
Again, the unemployment rate comes from the Household Survey.
Anyway that's one of the main reasons for the two to diverge big time. Another is the number of people who decide to look for a job (only people who have looked for work in the past 4 weeks are counted as unemployed in the official (U3) unemployment statistics.)
On statistical noise, I found this BLS technical note on sampling error -- http://www.bls.gov/news.release/empsit.tn.htm . Based on what it says, there is a 90% probability that the Establishment Survey's non-farm employment increase is within +/- 120,000 of the stated number. And a 10% chance that it is off by more than 120,000. Again, this is just the sampling error. There are other errors besides sampling error.
Correspondingly, again based on sampling error alone, there is a 50% chance that it is within +/- 49,200. So for example for a reported job gain of 200,000, there is a 50% chance that it is between 150,800 and 249,200, and a 50% chance that it is outside that range based on sampling error alone. Note there are errors other than sampling error that add to the uncertainty {1}
And in the Household Survey, there is a 90% chance that the monthly unemployment change is +/- 300,000 of the stated number (note this is 2.5 times the Establishment Survey's nonfarm employment's sampling error). Also, that there is a 90% chance that the unemployment rate is about +/- 0.2% of the stated number.
The above only covers sampling error. There are also many other sources of error (search the above link for "non-sampling error" ).
Particularly during this pandemic, with some Household Survey surveyors classifying some people on furlough as being employed when they are supposed to be classified as unemployed. For the August report, the BLS claims that the unemployment rate may be understated by a MAXIMUM of 0.7 percentage points due to this problem.
{1} 90% of the area under the normal curve is between +/- 1.645 standard deviations. 50% of the area under the normal curve is between +/- 0.675 standard deviations. Thus if there is a 90% chance that it is within +/- 120,000, then there is a 50% chance that it is within +/- 49,200 (0.675/1.645 * 120,000 = 49,240 , then round to 49,200 ).
===============================================
P.S. I'm not "smarter", it's just that I've dug into this particular issue.
===============================================
Still a huge huge incredible difference between job gains of 1.371 million (establishment survey) and 3.756 million (household survey)
mahatmakanejeeves
(57,495 posts)Good morning, all.
Wed Sep 2, 2020: Links to earlier reports:
Fri Aug 7, 2020: Links to earlier reports:
Wed Aug 5, 2020: Links to earlier reports:
Thu Jul 2, 2020: Links to earlier reports:
Fri Jun 5, 2020: Links to earlier reports:
Fri May 8, 2020: Links to earlier reports:
Friday, April 3, 2020: Links to earlier reports:
Wednesday, March 4, 2020: Links to earlier reports:
Friday, February 7, 2020: Links to earlier reports:
Thursday, January 9, 2020: Links to earlier reports:
Updated from this post of Friday, December 6, 2019: Good morning. Links to earlier reports:
-- -- -- -- -- --
[center]Past Performance is Not a Guarantee of Future Results.[/center]
Nonetheless, what is important is not this month's results, but the trend. Let’s look at some earlier numbers:
ADP® (Automatic Data Processing), for employment in August 2020:
Private-sector employment increased by 428,000 from July to August, on a seasonally adjusted basis.
Bureau of Labor Statistics, for employment in July 2020:
Nonfarm payroll employment rises by 1.8 million in July; unemployment rate falls to 10.2%
ADP® (Automatic Data Processing), for employment in July 2020:
Private-sector employment increased by 167,000 from June to July, on a seasonally adjusted basis.
Bureau of Labor Statistics, for employment in June 2020:
Nonfarm payroll employment rises by 4.8 million in June; unemployment rate falls to 11.1%
ADP® (Automatic Data Processing), for employment in June 2020:
ADP National Employment Report: Private Sector Employment Increased by 2,369,000 Jobs in June
Bureau of Labor Statistics, for employment in May 2020:
Unemployment rate drops to 13 percent, as the economy began to lose jobs at a slower pace
ADP® (Automatic Data Processing), for employment in May 2020:
Private-sector employment decreased by 2,760,000 from April to May, on a seasonally adjusted basis.
Bureau of Labor Statistics, for employment in April 2020:
Jobless rate soared to 14.7% in April as U.S. shed 20.5 million jobs amid coronavirus pandemic
ADP® (Automatic Data Processing), for employment in April 2020:
ADP National Employment Report: Private Sector Employment Decreased by 20,236,000 Jobs in April
Bureau of Labor Statistics, for employment in March 2020:
Nonfarm payroll employment falls by 701,000 in March; unemployment rate rises to 4.4%
ADP® (Automatic Data Processing), for employment in March 2020:
Private-sector employment decreased by 27,000 from February to March, on a seasonally adjusted basis
Bureau of Labor Statistics, for employment in February 2020:
The U.S. labor market showed strength in February, adding 273,000 jobs
ADP® (Automatic Data Processing), for employment in February 2020:
U.S. adds 183,000 private-sector jobs in February, ADP says
Bureau of Labor Statistics, for employment in January 2020:
The economy added 225,000 jobs in January, showing continued strength
ADP® (Automatic Data Processing), for employment in January 2020:
ADP says 291,000 private-sector jobs created in January, largest gain in 4 years
Bureau of Labor Statistics, for employment in December 2019:
Economy adds 145,000 jobs in December as unemployment rate remains at 3.5 percent
ADP® (Automatic Data Processing), for employment in December 2019:
U.S. private sector adds the most jobs in eight months
Bureau of Labor Statistics, for employment in November 2019:
Labor market remained strong in November as U.S. economy added 266,000 jobs
ADP® (Automatic Data Processing), for employment in November 2019:
U.S. private sector job growth slows down sharply in November: ADP
Bureau of Labor Statistics, for employment in October 2019:
U.S. economy added 128,000 jobs in October as GM strike displaced workers; jobless rate ticks up
Bureau of Labor Statistics, for employment in September 2019:
U.S. economy added just 136,000 jobs in September, in fresh sign economy is cooling
ADP® (Automatic Data Processing), for employment in September 2019:
ADP National Employment Report: Private Sector Employment Increased by 135,000 Jobs in September
Bureau of Labor Statistics, for employment in August 2019:
U.S. economy adds just 130,000 jobs in August amid worries
ADP® (Automatic Data Processing), for employment in August 2019:
Survey: Businesses added a solid 195,000 jobs in August
Bureau of Labor Statistics, for employment in July 2019:
U.S. Added 164,000 Jobs in July; Unemployment Rate at 3.7 Percent
ADP® (Automatic Data Processing), for employment in July 2019:
ADP says 156,000 private-sector jobs added created in July

durablend
(7,460 posts)duforsure
(11,885 posts)Everything trump does is corrupt, and these numbers are to. It's likely closer to 20% unemployed but trumps got them manipulating the numbers like he's doing with the trump virus., polls, and his weight. I don't trust any numbers from this serial liar and corrupt con man.

Cryptoad
(8,254 posts)that there were over 27M people drawing some form of UE assistance ... The Age of Maga Bean Counters have take "cooking the books to a new level!
samsingh
(17,599 posts)progree
(10,909 posts)Last edited Sun Sep 6, 2020, 02:30 AM - Edit history (3)
Everyone of these data series comes with a table and graph.
# Nonfarm Employment (Establishment Survey, https://data.bls.gov/timeseries/CES0000000001
Monthly changes (in thousands): https://data.bls.gov/timeseries/CES0000000001?output_view=net_1mth
2019: 269 1 147 210 85 182 194 207 208 185 261 184
2020: 214 251 -1373 -20787 2725 4781 1734 1371
Feb and March of 2020 are Corrected. July and August are Preliminary. In thousands
NOT SEASONALLY ADJUSTED: https://data.bls.gov/timeseries/CEU0000000001
# Employed in thousands from the separate Household Survey, http://data.bls.gov/timeseries/LNS12000000
Monthly changes (in thousands): http://data.bls.gov/timeseries/LNS12000000?output_view=net_1mth
2019: -198 239 -125 -45 148 304 198 549 403 246 -8 267
2020: -89 45 -2987 -22369 3839 4940 1350 3756
Jan and Feb of each year are affected by changes in population controls. In thousands
NOT SEASONALLY ADJUSTED: https://data.bls.gov/timeseries/LNU02000000
# Nonfarm PRIVATE Employment (Establishment Survey, https://data.bls.gov/timeseries/CES0500000001
Monthly changes: https://data.bls.gov/timeseries/CES0500000001?output_view=net_1mth
^-Good for comparison to the ADP report that typically comes out a few days earlier
NOT SEASONALLY ADJUSTED: https://data.bls.gov/timeseries/CEU0500000001
# INFLATION ADJUSTED Weekly Earnings of Production and Non-Supervisory Workers http://data.bls.gov/timeseries/CES0500000031
# Labor Force http://data.bls.gov/timeseries/LNS11000000?output_view=net_1mth
The labor force is the sum of employed and unemployed. To count as unemployed, one must have actively sought work in the past 4 weeks (just looking at want ads and job postings doesn't count)
Monthly change in thousands, 1st 8 months:
2020: 50 -60 -1633 -6432 1746 1705 -62 968
Total count in thousands, 1st 8 months:
2020: 164606 164546 162913 156481 158227 159932 159870 160838
August is down 3.708 million from February -- lots of people are discouraged from looking because of poor prospects and/or concerns over coronavirus
January and February data affected by changes in population controls.
# Unemployed http://data.bls.gov/timeseries/LNS13000000
2020: 5892 5787 7140 23078 20985 17750 16338 13550 (in thousands)
(but continuing claims for unemployment insurance IN ALL PROGRAMS for the week ending August 15 was 29225 thousand, it's higher because, because, because it's not lower and its not the same, that's why
 )
)
https://www.dol.gov/ui/data.pdf
The total number of people claiming benefits in all programs for the week ending August 15 was 29,224,546, an increase of 2,195,835 from the previous week. There were 1,639,622 persons claiming benefits in all programs in the comparable week in 2019.
# ETPR (Employment-To-Population Ratio) aka Employment Rate http://data.bls.gov/timeseries/LNS12300000
# LFPR (Labor Force Participation rate) http://data.bls.gov/timeseries/LNS11300000
# Unemployment rate http://data.bls.gov/timeseries/LNS14000000
# U-6 unemployment rate http://data.bls.gov/timeseries/LNS13327709
# NILF -- Not in Labor Forcehttp://data.bls.gov/timeseries/LNS15000000
# NILF-WJ -- Not in Labor Force, Wants Job http://data.bls.gov/timeseries/LNS15026639
# Part-Time Workers who want Full-Time Jobs (Table A-8's Part-Time For Economic Reasons) http://data.bls.gov/timeseries/LNS12032194
# Part-Time Workers (Table A-9) http://data.bls.gov/timeseries/LNS12600000
# Full-Time Workers (Table A-9) http://data.bls.gov/timeseries/LNS12500000
# Multiple Jobholders as a Percent of Employed (Table A-9) https://data.bls.gov/timeseries/LNS12026620
# Civilian non-institutional population https://data.bls.gov/timeseries/LNS10000000
# Black unemployment rate https://data.bls.gov/timeseries/LNS14000006
First 8 months of 2020: 6.0 5.8 6.7 16.7 16.8 15.4 14.6 13.0 Trump: "what have you got to lose?"
# Hispanic or Latino unemployment rate https://data.bls.gov/timeseries/LNS14000009
First 8 months of 2020: 4.3 4.4 6.0 18.9 17.6 14.5 12.9 10.5
# White unemployment rate https://data.bls.gov/timeseries/LNS14000003
First 8 months of 2020: 3.1 3.1 4.0 14.2 12.4 10.1 9.2 7.3
LFPR - Labor Force Participation Rate for some age groups
The LFPR is the Employed + jobless people who have looked for work in the last 4 weeks (and say they want a job and are able to take one if offered). All divided by the civilian non-institutional population age 16+.
SA means Seasonally adjusted. NSA means Not Seasonally Adjusted
16+: SA: http://data.bls.gov/timeseries/LNS11300000 NSA: http://data.bls.gov/timeseries/LNU01300000
25-34: SA: http://data.bls.gov/timeseries/LNS11300089 NSA: http://data.bls.gov/timeseries/LNU01300089
25-54: SA: http://data.bls.gov/timeseries/LNS11300060 NSA: http://data.bls.gov/timeseries/LNU01300060
55+: SA: http://data.bls.gov/timeseries/LNS11324230 NSA: http://data.bls.gov/timeseries/LNU01324230
65+: SA: ---------------- NSA: http://data.bls.gov/timeseries/LNU01300097
LFPR - Labor Force Particpation Rate (prime age 25-54) by gender
All: http://data.bls.gov/timeseries/LNS11300060
Men: http://data.bls.gov/timeseries/LNS11300061
Women: http://data.bls.gov/timeseries/LNS11300062
ETPR - Employment to Population Ratio for some age groups
SA means Seasonally adjusted. NSA means Not Seasonally Adjusted
16+: SA: http://data.bls.gov/timeseries/LNS12300000 NSA: http://data.bls.gov/timeseries/LNU02300000
25-34: http://data.bls.gov/timeseries/LNS12300089 NSA: http://data.bls.gov/timeseries/LNU02300089
25-54: SA: http://data.bls.gov/timeseries/LNS12300060 NSA: http://data.bls.gov/timeseries/LNU02300060
55+: SA: http://data.bls.gov/timeseries/LNS12324230 NSA: http://data.bls.gov/timeseries/LNU02324230
65+: SA: ---------------- NSA: http://data.bls.gov/timeseries/LNU02300097
BumRushDaShow
(129,106 posts) yaesu
(8,020 posts)GeorgeGist
(25,321 posts)
LenaBaby61
(6,974 posts)Yeah, no.
I don't believe ANYTHING coming our of this Administration, the SAME tRump administration whose making the CDC into what fat ass wants it to be.
So like you, I don't believe these numbers are reliable, because fatso and his administration lie so much, and they're not forcing agencies like CDC to lie for them.

ProfessorGAC
(65,076 posts)It was 9.2 when PINO took office.
So much winning.
progree
(10,909 posts)ProfessorGAC
(65,076 posts)I got the number from BLS.
It popped up on the first paragraph of the first link in Google.
The Jan 2017 number I got from the interactive graph.
progree
(10,909 posts)Last edited Thu Sep 10, 2020, 07:44 PM - Edit history (2)
The big discrepancy between jobs report 13.6 M unemployed, and 29.2 M collecting benefits
This article, dated 6/16/20, and covering the May unemployment report purports to explain the discrepancy that showed up in May:
https://www.cnbc.com/2020/06/16/there-are-more-people-getting-unemployment-benefits-than-there-are-unemployed-workers.html
# the key point is that the requirement that people be looking for work in order to collect unemployment benefits has been suspended during the pandemic -- but was that still true in August, for example?
whereas to be counted as unemployed in the BLS's monthly job report (and to be included in the U-3 unemployment rate), the surveyed person must tell the surveyor that he/she looked for work sometime in the past 4 weeks (and it must be something more than looking at want ads - it must be activities like sending out resumes, filling out applications, and so on). (The unemployment numbers come from a monthly Household Survey of 60,000 households).
There's much more on this at https://www.democraticunderground.com/100214030232#post3
Anyway, that's a huge gap (13.6 M vs. 29.2 M) to try to explain.
progree
(10,909 posts)UNEMPLOYMENT INSURANCE WEEKLY CLAIMS, Department of Labor, 9/10/20
https://www.dol.gov/ui/data.pdf
The advance seasonally adjusted insured unemployment rate was 9.2 percent for the week ending August 29, an increase of 0.1 percentage point from the previous week's unrevised rate. The advance number for seasonally adjusted insured unemployment during the week ending August 29 was 13,385,000, an increase of 93,000 from the previous week's revised level. The previous week's level was revised up 38,000 from 13,254,000 to 13,292,000. The 4-week moving average was 13,982,000, a decrease of 523,750 from the previous week's revised average. The previous week's average was revised up by 9,500 from 14,496,250 to 14,505,750.
(snip)
UNADJUSTED DATA
(snip)
The total number of people claiming benefits in all programs for the week ending August 22 was 29,605,064, an increase of 380,379 from the previous week. There were 1,591,456 persons claiming benefits in all programs in the comparable week in 2019 ((this paragraph not seasonally adjusted, they don't have a seasonally adjusted version of this number -Progree)).
Not good that initial claims is flat in a so-called Great American Comeback. And that the total number claiming benefits is going up -- it was 27.0 million 2 weeks before. Note too the discrepancy between the 13.6 million unemployed in last Friday's jobs report (the one with the 8.4% unemployment rate), and the 29.6 million claiming benefits.
mahatmakanejeeves
(57,495 posts)In just four months, the unemployment rate has gone down by 6.3 percentage points.
It took nearly nine YEARS following the Great Recession peak in October 2009 to make the same recovery.
The Great American Comeback is underway! Flag of United States
Link to tweet
BumRushDaShow
(129,106 posts)
(from the May interim CBO report - the CBO seemed to focus on GDP with their July & September updates)
mahatmakanejeeves
(57,495 posts)progree
(10,909 posts)Last edited Sat Sep 19, 2020, 10:58 AM - Edit history (1)
by Wolf Richter • Sep 10, 2020 •
Continued unemployment claims rise for second week, to 29.6 million, worst since Aug 1, meaning 18.4% of labor force is on unemployment insurance. State & federal initial claims jumped to 1.7 million in the week (not seasonally adjusted).
Total continued claims for unemployment insurance (UI) under all state and federal programs rose by 380,000, to 29.6 million people (not seasonally adjusted), the highest since August 1, according to the Department of Labor this morning. This was the second weekly increase in a row, after the 2.2-million jump last week.
These 29.6 million people who continued to claim UI under all programs translate into 18.4% of the civilian labor force of 161 million:
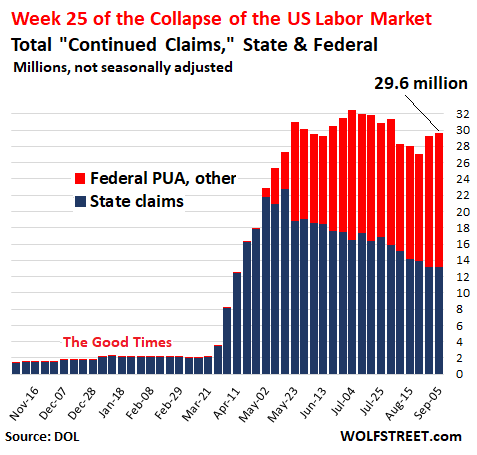
Blue columns – continued claims under state programs: +54k
The number of people who continued claiming UI under state programs rose by 54k to 13.2 million (not seasonally adjusted), the first increase after five decreases in a row. .........(more)
https://wolfstreet.com/2020/09/10/unemployment-crisis-going-in-wrong-direction-week-25-of-u-s-labor-market-collapse/
===================================================
Thanks marmar for the post in the Economy Group.
The ultimate source of the numbers: https://www.dol.gov/ui/data.pdf
Something I've been yammering about for quite some time. It went from 27.0 million to 29.6 million in 2 weeks.
As always, note the discrepancy between 29.6 M continuing claims, and the BLS's Friday (9/4) job report of 13.6 M unemployed, https://www.democraticunderground.com/100214030232#post3 .