U.S. Added 164,000 Jobs in July; Unemployment Rate at 3.7 Percent
Source: New York Times
The Numbers
Just two days after the Federal Reserve moved to ward off economic snags by paring interest rates, the monthly jobs report signals that the labor market is maintaining its energy during a record-long hiring streak. While last month's payroll additions did not match the thumping gains in June, July's numbers show that employers continue to make room for new job seekers.
"These things bounce around," Jim O'Sullivan, chief economist at High Frequency Economics, said of the Labor Department's employment report. "But the trend is still strong enough to keep unemployment down." The number of new applicants applying for unemployment insurance has stayed low. And as long as employers create roughly 100,000 jobs each month, the labor market can keep pace with population growth and the jobless rate will hold steady. The report reinforces the Fed's stance that the economy's underpinnings remain strong, even though it is unlikely to temper the push for further rate cuts from investors and President Trump.
Read more: https://www.nytimes.com/2019/08/02/business/economy/july-jobs-report.html
Our resident DU economic analysts should be along soon. TGIF!
 = new reply since forum marked as read
Highlight:
NoneDon't highlight anything
5 newestHighlight 5 most recent replies
= new reply since forum marked as read
Highlight:
NoneDon't highlight anything
5 newestHighlight 5 most recent replies

progree
(10,910 posts)jobs than in June's report that came out 7/5/19.
164,000-41,000 = 123,000
The great 2019 job slowdown continues ...
https://www.bls.gov/news.release/empsit.nr0.htm
Not very MAGA-torial.

BumRushDaShow
(129,236 posts)And especially for that further downward revision going back to May as well. 
ETA this -
Wellstone ruled
(34,661 posts)the juice is in,seems like each month we are seeing a revision of at least 10%. July is the month of High levels of Temp Hires do simply to the Vacation Run,runs through August. These hires were then kept to do the ramp up for the Holiday and then cut loose on or before Thanksgiving.
This past week there was a up tick in LTL Freight shipments,but,after the new round of Tariff's,my guess is,these Retail shipments were sitting on the Docks and Warehouses and needed to be moved due to storage costs and quality issues.
Are we going to see a major retail Depression in the coming weeks,sure looking that way today.
progree
(10,910 posts)months compared to other months. Maybe I'm not understanding your point on the temp hires.
Not sure that the revisions are any greater in sign or magnitude than what I've seen in the past years since I've been doing this (since sometime before 2012). The payroll jobs numbers have a 90% probability of being within +/- 120,000, and that's just sampling error (there are other kinds of errors). http://www.bls.gov/news.release/empsit.tn.htm
But I am a big believer that things are slowing down.
Wellstone ruled
(34,661 posts)than Temp hires off the street.
And yes,the economy is slowing big time. Noticed yesterday the overstocked Retail Shelves meaning inventories are out of whack due to slowing sales.
People are pulling in their horns.
progree
(10,910 posts)Last edited Fri Aug 2, 2019, 10:33 AM - Edit history (1)
Employed: https://data.bls.gov/timeseries/LNS12000000
For last 10 minutes -- spinning progress wheel followed by a blank screen.
I noticed that last month too --
except for today and last month, this never happened before. Benito Cheetolini is not keeping the trains running on time.
Fortunately 90% of what I need is at http://www.bls.gov/news.release/pdf/empsit.pdf which I downloaded successfully
but sometimes it helps to have the full time series of some stats ... damn.
Like Employed is up only 343,000 over the last 7 months (January thru July) which comes to just 49,000/month average ... I got that figure from a quick addition, so wanted to verify and that's when I began getting the blank screens... (Later edit: the above figures are accurate)
Edited to Add (9:40 AM ET) - From the BLS home page (bls.gov), I clicked on the (headline) Payroll Employment data series, (which is https://data.bls.gov/timeseries/CES0000000001?output_view=net_1mth ), and got
The server encountered an internal error or misconfiguration and was unable to complete your request.
Please contact the server administrator at dews_support@bls.gov to inform them of the time this error occurred, and the actions you performed just before this error.
More information about this error may be available in the server error log.
Benito Cheetolini! Fix this!
EDIT 1007 AM ET -- it's been highly responsive for the last 10 minutes or so.

mahatmakanejeeves
(57,547 posts)[center]Past Performance is Not a Guarantee of Future Results.[/center]
Nonetheless, what is important is not this month's results, but the trend. Let’s look at some earlier numbers:
ADP® (Automatic Data Processing), for employment in July 2019:
ADP says 156,000 private-sector jobs added created in July
Bureau of Labor Statistics, for employment in June 2019:
Hiring rebounds as U.S. economy adds 224,000 jobs in June;unemployment rate inched up to 3.7 percent
ADP® (Automatic Data Processing), for employment in June 2019:
U.S. private sector hiring picks up less than expected in June: ADP
Bureau of Labor Statistics, for employment in May 2019:
The U.S. economy added only 75,000 jobs in May amid bite from Trump's trade war
ADP® (Automatic Data Processing), for employment in May 2019:
ADP private-sector job growth tumbles to a 9-year low in May
Bureau of Labor Statistics, for employment in April 2019:
UPDATE: U.S. unemployment fell to 3.6 percent, lowest since 1969
ADP® (Automatic Data Processing), for employment in April 2019:
ADP National Employment Report: Private Sector Employment Increased by 275,000 Jobs in April
Bureau of Labor Statistics, for employment in March 2019:
UPDATE: U.S. added 196,000 jobs in March as economy shows signs of spring bounce
ADP® (Automatic Data Processing), for employment in March 2019:
Private sector hiring falls to 18-month low, and manufacturing sheds jobs, ADP says
Bureau of Labor Statistics, for employment in February 2019:
U.S. adds meager 20,000 jobs in February to mark smallest increase in 17 months
ADP® (Automatic Data Processing), for employment in February 2019:
ADP National Employment Report: Private Sector Employment Increased by 183,000 Jobs in February
Bureau of Labor Statistics, for employment in January 2019:
U.S. creates 304,000 jobs in January, unemployment rises to 4%
ADP® (Automatic Data Processing), for employment in January 2019:
U.S. added 213,000 private-sector jobs in January, ADP says
Bureau of Labor Statistics, for employment in December 2018:
Payroll employment increases by 312,000 in December; unemployment rate rises to 3.9%
ADP® (Automatic Data Processing), for employment in December 2018:
U.S. adds most private-sector jobs in almost 2 years, says ADP
Bureau of Labor Statistics, for employment in November 2018:
Payroll employment increases by 155,000 in November; unemployment rate unchanged at 3.7%
ADP® (Automatic Data Processing), for employment in November 2018:
U.S. adds 179,000 private-sector jobs in November: ADP
Bureau of Labor Statistics, for employment in October 2018:
The U.S. economy added 250,000 jobs in October, unemployment stays at 3.7 percent
ADP® (Automatic Data Processing), for employment in October 2018:
ADP National Employment Report: Private Sector Employment Increased by 227,000 Jobs in October 2018:
Bureau of Labor Statistics, for employment in September 2018:
Unemployment rate declines to 3.7% in September; payroll employment increases by 134,000
ADP® (Automatic Data Processing), for employment in September 2018:
U.S. adds 230,000 private-sector jobs in September: ADP
Bureau of Labor Statistics, for employment in August 2018:
U.S. Added 201,000 Jobs in August; Unemployment Rate Steady at 3.9%
ADP® (Automatic Data Processing), for employment in August 2018:
U.S. Firms in August Added Fewest Workers in 10 Months, ADP Says
Bureau of Labor Statistics, for employment in July 2018:
Payroll employment increases by 157,000 in July; unemployment rate edges down to 3.9%
ADP® (Automatic Data Processing), for employment in July 2018:
ADP National Employment Report: Private Sector Employment Increased by 219,000 Jobs in July
Bureau of Labor Statistics, for employment in June 2018:
U.S. Added 213,000 Jobs in June; Unemployment Ticks Up to 4%
ADP® (Automatic Data Processing), for employment in June 2018:
ADP National Employment Report: Private Sector Employment Increased by 177,000 Jobs in June
Bureau of Labor Statistics, for employment in May 2018:
U.S. economy extends its hiring spree, with a better than expected 223,000 new jobs in May
ADP® (Automatic Data Processing), for employment in April 2018:
U.S. adds 204,000 private-sector jobs in April, ADP report shows
BumRushDaShow
(129,236 posts)
Lots of downward revisions of past reports today!
mahatmakanejeeves
(57,547 posts)Economic News Release USDL-19-1388
Employment Situation Summary
Transmission of material in this news release is embargoed until 8:30 a.m. (EDT) Friday, August 2, 2019
Technical information:
Household data: (202) 691-6378 * cpsinfo@bls.gov * www.bls.gov/cps
Establishment data: (202) 691-6555 * cesinfo@bls.gov * www.bls.gov/ces
Media contact: (202) 691-5902 * PressOffice@bls.gov
THE EMPLOYMENT SITUATION -- JULY 2019
Total nonfarm payroll employment rose by 164,000 in July, and the unemployment rate was unchanged at 3.7 percent, the U.S. Bureau of Labor Statistics reported today. Notable job gains occurred in professional and technical services, health care, social assistance, and financial activities.
This news release presents statistics from two monthly surveys. The household survey measures labor force status, including unemployment, by demographic characteristics. The establishment survey measures nonfarm employment, hours, and earnings by industry. For more information about the concepts and statistical methodology used in these two surveys, see the Technical Note.
Household Survey Data
The unemployment rate held at 3.7 percent in July, and the number of unemployed persons was little changed at 6.1 million. (See table A-1.)
Among the major worker groups, the unemployment rate for Asians increased to 2.8 percent in July. The jobless rates for adult men (3.4 percent), adult women (3.4 percent), teenagers (12.8 percent), Whites (3.3 percent), Blacks (6.0 percent), and Hispanics (4.5 percent) showed little or no change over the month. (See tables A-1, A-2, and A-3.)
In July, the number of persons unemployed less than 5 weeks increased by 240,000 to 2.2 million, while the number of long-term unemployed (those jobless for 27 accounted for 19.2 percent of the unemployed. (See table A-12.)
In July, the labor force participation rate was 63.0 percent, and the employment- population ratio was 60.7 percent. Both measures were little changed over the month and over the year. (See table A-1.)
The number of persons employed part time for economic reasons (sometimes referred to as involuntary part-time workers) declined by 363,000 in July to 4.0 million. These individuals, who would have preferred full-time employment, were working part time because their hours had been reduced or they were unable to find full- time jobs. Over the past 12 months, the number of involuntary part-time workers has declined by 604,000. (See table A-8.)
In July, 1.5 million persons were marginally attached to the labor force, essentially unchanged from a year earlier. (Data are not seasonally adjusted.) These individuals were not in the labor force, wanted and were available for work, and had looked for a job sometime in the prior 12 months. They were not counted as unemployed because they had not searched for work in the 4 weeks preceding the survey. (See table A-16.)
Among the marginally attached, there were 368,000 discouraged workers in July, down by 144,000 from a year earlier. (Data are not seasonally adjusted.) Discouraged workers are persons not currently looking for work because they believe no jobs are available for them. The remaining 1.1 million persons marginally attached to the labor force in July had not searched for work for reasons such as school attendance or family responsibilities. (See table A-16.)
Establishment Survey Data
Total nonfarm payroll employment increased by 164,000 in July, in line with average employment growth in the first 6 months of the year. In 2018, employment gains had averaged 223,000 per month. In July, notable job gains occurred in professional and technical services (+31,000), health care (+30,000), social assistance (+20,000), and financial activities (+18,000). (See table B-1.)
Professional and technical services added 31,000 jobs in July, bringing the 12-month job gain to 300,000. In July, employment increased by 11,000 in computer systems design and related services; this industry accounted for about one-third of employment growth in professional and technical services both over the month and over the year.
Employment in health care rose by 30,000 over the month, reflecting a gain in ambulatory health care services (+29,000). Health care employment has increased by 405,000 over the year, with ambulatory health care services accounting for about two-thirds of the gain.
Social assistance added 20,000 jobs in July. Employment in this industry has increased by 143,000 over the year.
In July, financial activities employment rose by 18,000, with most of the gain occurring in insurance carriers and related activities (+11,000).
Mining employment declined by 5,000 in July, after showing little net change in recent months.
Manufacturing employment changed little in July (+16,000) and thus far in 2019. Job gains in the industry had averaged 22,000 per month in 2018.
Employment in other major industries, including construction, wholesale trade, retail trade, transportation and warehousing, information, leisure and hospitality, and government, changed little over the month.
In July, average hourly earnings for all employees on private nonfarm payrolls rose by 8 cents to $27.98, following an 8-cent gain in June. Over the past 12 months, average hourly earnings have increased by 3.2 percent. In July, average hourly earnings of private-sector production and nonsupervisory employees rose by 4 cents to $23.46. (See tables B-3 and B-8.)
The average workweek for all employees on private nonfarm payrolls decreased by 0.1 hour to 34.3 hours in July. In manufacturing, the average workweek decreased by 0.3 hour to 40.4 hours, and overtime declined by 0.2 hour to 3.2 hours. The average workweek of private-sector production and nonsupervisory employees declined by 0.1 hour to 33.5 hours. (See tables B-2 and B-7.)
The change in total nonfarm payroll employment for May was revised down by 10,000 from +72,000 to +62,000, and the change for June was revised down by 31,000 from +224,000 to +193,000. With these revisions, employment gains in May and June combined were 41,000 less than previously reported. (Monthly revisions resultfrom additional reports received from businesses and government agencies sincethe last published estimates and from the recalculation of seasonal factors.) After revisions, job gains have averaged +140,000 per month over the last 3 months.
_____________
The Employment Situation for August is scheduled to be released on Friday, September 6, 2019, at 8:30 a.m. (EDT).
_______________________________________________________________________
2019 Preliminary Benchmark Revision to Establishment Survey Data to be released on August 21, 2019
Each year, the establishment survey estimates are benchmarked to comprehensive counts of employment from the Quarterly Census of Employment and Wages (QCEW) for the month of March. These counts are derived from state unemployment insurance (UI) tax records that nearly all employers are required to file. On August 21, 2019, at 10:00 a.m. (EDT), the Bureau of Labor Statistics (BLS) will release the preliminary estimate of the upcoming annual benchmark revision. This is the same day the first-quarter 2019 data from QCEW will be issued. Preliminary benchmark revisions for all major industry sectors, as well as total nonfarm and total private employment, will be available on the BLS website at www.bls.gov/web/empsit/cesprelbmk.htm.
The final benchmark revision will be issued with the publication of the January 2020 Employment Situation news release in February 2020.
* * * * *
[center]Facilities for Sensory Impaired[/center]
Information from these releases will be made available to sensory impaired individuals upon request. Voice phone: 202-691-5200, Federal Relay Services: 1-800-877-8339.

Bengus81
(6,932 posts)Oh...of course all so their em..."associates" can spend more time on the floor helping customers. My azzzzz.........

Historic NY
(37,452 posts)Revisions to previous reports reduced job creation in prior months by 41,000. Payroll gains have clearly slowed since last year when the average monthly gain was 223,000. The monthly average for the last three months was 140,000.
mahatmakanejeeves
(57,547 posts)It's been in the final paragraph of the BLS news release for a long time. You can see for yourself:
Good morning. Thanks for the thread. Links to earlier reports:
progree
(10,910 posts)Last 6 months: 141,000 / month average
https://data.bls.gov/timeseries/CES0000000001
https://data.bls.gov/timeseries/CES0000000001?output_view=net_1mth
rockfordfile
(8,704 posts)
safeinOhio
(32,706 posts)"trump has created millions of jobs, I know because I have 3 of them and still can't pay my rent."
progree
(10,910 posts)Summary: Average monthly net new jobs created
220,000 Obama's last 30 months (includes all of January 2017)
191,000 Trump's 30 months (February 2017 through July 2019)
165,000 2019 so far (January through July)
141,000 February through July 2019
Job numbers: https://data.bls.gov/timeseries/CES0000000001
Monthly changes: https://data.bls.gov/timeseries/CES0000000001?output_view=net_1mth
And yes yes, the unemployment rate is at about 50 year lows, but note that the prime age (25-54) labor force participation rate is below the pre-Great Recession average, going back to about 1987. (And it dropped another 0.2% in July)
http://data.bls.gov/timeseries/LNS11300060
https://www.democraticunderground.com/?com=view_post&forum=1002&pid=12256909
BumRushDaShow
(129,236 posts)I experienced the same thing with the hung site (I think that was when I was looking at it at ~9:40 am EDT). Looking at it now, it came up instantly.
Thanks for that analysis! 
There's an undercurrent of something going on that I can't put my finger definitely on yet - i.e., something as sinister as a significant uptick in coordinated armed robberies - including where I live - the manner of which suggests whole criminal operations have set up shop in this city. 
progree
(10,910 posts)that were highly organized and coordinated. They'd hit one suburb for a night (several houses), and then move on to another suburb. Nothing like I've ever heard of before.
mahatmakanejeeves
(57,547 posts)U.S. Economy Added 164,000 New Jobs in July; Nominal Average Wages Increased 3.2 Percent Over the Past 12 Months
August 2, 2019 4 minute read
Council of Economic Advisers
The Bureau of Labor Statistics (BLS) released its monthly Employment Situation Report, showcasing robust employment and an acceleration in wage growth. Total nonfarm payroll employment in July increased by 164,000 jobs, in line with market expectations (165,000). Including revisions for the months of May and June, the average pace of job growth has been a vigorous 187,000 jobs per month over the past year and 165,000 jobs so far in 2019, which is higher than CBO or the Federal Reserve anticipated for this cycle. The 12-month average remains above the 2017 average of 179,000 jobs gained per month. In total, the economy has added over 6.2 million jobs since the President was elected.

The July jobs report revealed yet another month of strong job growth. Since the President was elected, job gains have surpassed 100,000 jobs in 29 of the 32 months. The average job growth over the past 6 months is a healthy 141,000 jobs. Considering the unprecedented length of the expansion, job gains are strong. In July 2019, just over 6 million people were unemployed, compared with more than 14 million in July 2009 at the beginning of the economic expansion. Given low unemployment, monthly job gains of this size indicate that the labor market is truly flourishing.
Education and health services industry led job growth in July adding 66,000 jobs. The professional and business services sector saw the second largest job growth, an increase of 38,000 jobs. Manufacturing jobs increased as well, gaining 16,000 jobs in July, including 7,200 jobs in motor vehicle and parts manufacturing. Since the President’s election, the manufacturing industry has added 523,000 jobs and added 157,000 jobs in the past 12 months.
In July, wages continued to grow as well. Nominal average hourly earnings rose 3.2 percent over the past 12 months, marking the 12th straight month that year-over-year wage gains were at or above 3 percent (see figure). Prior to 2018, nominal average hourly wage gains had not reached 3 percent in over 10 years (since April 2009). Nominal wage growth has accelerated since the passage of the Tax Cuts and Jobs Act (TCJA). When taking inflation into account, there is evidence that real wages are also growing. Based on the most recent Personal Consumption Expenditures (PCE) price index data from June, inflation in the past year was 1.4 percent, and based on the most recent Consumer Price Index (CPI-U) price data from June, the inflation in the past year was 1.6 percent (July inflation data is not yet available for either series).
A separate household survey released by BLS shows that the unemployment rate remained at 3.7 percent in July, making July the 17th consecutive month at or below 4 percent. The labor market also continues to benefit all Americans. The African American unemployment rate remained at 6.0 percent, just above the historic low of 5.9 percent set in May 2018, and the African-American teen unemployment rate dropped to its lowest rate since the series began in 1972. The U-6 unemployment rate, which is a broader measure of underutilization in the labor market that includes those looking for work, marginally attached to the labor force, and part-time for economic reasons, hit 7.0 percent, its lowest point since 2000.
The labor force participation rate—which includes people who are working and those looking for work—edged up by 0.1 percentage point to 63.0 percent and is 0.3 percentage point above the rate when the President was elected in November 2016. The labor force participation rate for prime-age adults (ages 25-54), which largely avoids the demographic effects of the aging population, decreased by 0.2 percentage point to at 82.0 percent—0.6 percentage point above its rate in November 2016.
The Trump Administration’s pro-growth policies continue to pull workers off the sidelines and foster a prosperous economy. Despite the continued low unemployment rates over the past year, there may still be workers on the sidelines, a situation economists refer to as “labor slack.” Because labor market slack still exists, employment can continue to rise and the economy can continue to grow as workers reenter the labor force. In July, 73.8 percent of workers entering employment came from out of the labor force rather than from unemployment.
The July employment data demonstrate that the American economy remains strong, with a consistently low unemployment rate, strong wage growth, and robust job gains.
progree
(10,910 posts)Last edited Fri Aug 2, 2019, 05:33 PM - Edit history (1)
Labor Force Participation Rate: http://data.bls.gov/timeseries/LNS11300000
Year Jan Feb Mar Apr May Jun Jul Aug Sep Oct Nov Dec
2016: 62.7 62.8 62.9 62.8 62.7 62.7 62.8 62.9 62.9 62.8 62.7 62.7
2017: 62.9 62.9 62.9 62.9 62.8 62.8 62.9 62.9 63.1 62.7 62.8 62.7
2018: 62.7 63.0 62.9 62.8 62.8 62.9 62.9 62.7 62.7 62.9 62.9 63.1
2019: 63.2 63.2 63.0 62.8 62.8 62.9 63.0
It's also down for the year
And small wonder: the Labor force only grew by 111,000 since December, (January thru July: +111,000, which is a 15,857/mo average). http://data.bls.gov/timeseries/LNS11000000?output_view=net_1mth . Not very MAGA-torial
And the Prime Age (25-54) LFPR has been falling since January: January: 82.6, June: 82.2 July: 82.0 (January 2017: 81.5) http://data.bls.gov/timeseries/LNS11300060
Year Jan Feb Mar Apr May Jun Jul Aug Sep Oct Nov Dec
1987: 82.2 82.3 82.4 82.5 82.6 82.5 82.6 82.6 82.6 82.7 82.6 82.7
1988: 82.6 82.7 82.8 82.8 82.8 82.6 82.8 83.0 82.9 83.0 83.3 83.2
1989: 83.5 83.4 83.3 83.3 83.2 83.2 83.3 83.3 83.6 83.5 83.8 83.7
1990: 83.8 83.8 83.6 83.5 83.5 83.4 83.4 83.4 83.4 83.4 83.5 83.4
1991: 83.2 83.5 83.4 83.7 83.4 83.4 83.3 83.4 83.4 83.4 83.4 83.2
1992: 83.5 83.4 83.5 83.7 83.8 83.9 83.8 83.8 83.6 83.5 83.5 83.4
1993: 83.3 83.1 83.2 83.2 83.4 83.6 83.5 83.5 83.4 83.5 83.6 83.6
1994: 83.4 83.5 83.3 83.2 83.3 82.9 83.2 83.3 83.6 83.5 83.6 83.5
1995: 83.5 83.6 83.5 83.7 83.5 83.3 83.4 83.3 83.5 83.4 83.5 83.4
1996: 83.5 83.5 83.5 83.6 83.7 83.6 83.9 84.0 83.9 84.1 84.1 84.1
1997: 84.0 83.9 84.0 84.0 83.8 84.1 84.3 84.5 84.3 84.2 84.0 84.1
1998: 84.0 84.1 84.2 83.9 83.9 84.0 84.1 84.1 84.2 84.1 84.1 84.2
1999: 84.6 84.4 84.0 84.1 84.1 84.1 83.9 84.0 84.0 84.1 84.2 84.0
2000: 84.4 84.4 84.3 84.4 84.1 84.1 83.9 83.8 83.7 83.6 83.8 83.9
2001: 84.1 84.1 84.1 83.7 83.8 83.6 83.6 83.5 83.5 83.6 83.5 83.7
2002: 83.5 83.7 83.5 83.6 83.6 83.2 83.1 83.2 83.3 83.2 82.9 83.1
2003: 82.9 83.0 83.1 83.2 83.1 83.3 83.0 83.0 82.8 82.9 82.8 82.8
2004: 82.8 82.7 82.8 82.7 82.8 82.9 83.0 82.7 82.7 82.6 82.7 82.6
2005: 82.7 82.8 82.6 82.7 82.9 82.6 82.8 82.9 82.9 82.7 82.7 82.7
2006: 82.8 82.9 83.0 82.8 82.8 82.8 83.0 82.9 82.9 82.9 83.0 83.1
2007: 83.4 83.2 83.2 83.0 83.0 82.9 82.9 82.9 82.8 82.7 82.9 83.1
2008: 83.3 83.2 83.3 83.1 83.1 83.1 83.1 83.2 83.1 83.0 83.0 82.8
2009: 82.8 82.8 82.6 82.8 82.9 82.9 82.8 82.8 82.5 82.5 82.4 82.0
2010: 82.4 82.3 82.4 82.6 82.3 82.2 81.9 82.0 82.0 81.8 82.0 81.9
2011: 81.7 81.6 81.7 81.7 81.7 81.7 81.4 81.6 81.5 81.3 81.5 81.6
2012: 81.5 81.5 81.5 81.4 81.4 81.5 81.4 81.4 81.5 81.6 81.2 81.4
2013: 81.1 81.0 81.0 81.0 81.2 81.2 81.2 81.0 81.0 80.6 81.0 80.8
2014: 80.9 81.1 81.1 80.8 80.7 81.0 80.8 81.1 80.8 80.9 80.9 80.9
2015: 81.0 80.9 80.8 81.0 81.0 80.9 80.7 80.7 80.6 80.8 80.9 81.0
2016: 81.2 81.1 81.4 81.2 81.1 81.3 81.2 81.3 81.5 81.6 81.4 81.4
2017: 81.5 81.6 81.6 81.7 81.6 81.6 81.8 81.7 81.8 81.6 81.8 81.9
2018: 81.8 82.1 82.0 81.9 81.8 82.1 82.1 82.0 81.8 82.3 82.2 82.3
2019: 82.6 82.5 82.5 82.2 82.1 82.2 82.0
EDIT TO ADD:
Yes, Trump has had a pretty good 2017 and 2018. But 2019 is sucking an egg, e.g. only 141,000 jobs/mo average over the last 6 months (191,000/average in 2019 including January).
And the declining LFPR's in 2019 -- you get to decide whether people's preferences for working or not has suddenly changed or not (these numbers are seasonally adjusted BTW).
And the prime age (25-54) LFPR down from pre-Great Recession average going all the way back to 1987. Some say (without any evidence) that preferences for working have declined, so no big deal. You get to decide.
Some say that 3 million "illegals" in California voted for Hillary in 2016, without citing any evidence. You get to decide.
And the stock market, which one may think has been great continuing to the present (excepting today and the last two days) is up only 1.6% since January 26, 2018 as of a moment ago when I checked (S&P 500 at 2920, it closed Jan 26, 2018 at 2873). Not very MAGA-torial for an 18 month period.
progree
(10,910 posts)"Not a real recovery, phony numbers" 9/7/12
"We can rev up this economy like it should be, not with false numbers" 8/11/13
"... totally phony number." 5/31/14
"Nobody has jobs ... it is not a real economy. It is a phony set of numbers." 10/11/15
"The terrible jobs report that just came out... phony numbers" 11/4/16
Link to tweet
/photo/1
mathematic
(1,439 posts)Jobs #s aren't "low" due to weakness, they're "low" due to strength. 97.2% of people that want a job and have looked for a job in the last month HAVE a job.
The civilian, non-institutional population is growing by 188k a month (table A in the data series). If 2/3rds of them want to participate in the labor force, that's 123k jobs per month that need to be created to accommodate them.
There simply aren't enough people not in the labor force that want to enter the labor force to continue the gigantic jobs numbers of the past. I know a lot of ink has been spilled over the idea that there is something "wrong" with our economy because the labor force participation rate is lower than it has been historically but that's always been nonsense. There's nothing wrong with people that don't have to work not working. It's looking more and more like the low labor force participation rate was not due to a bad economy it was due to a changing preference for working, across the entire population.
BumRushDaShow
(129,236 posts)mathematic
(1,439 posts)I didn't respond to any single post because my point addresses many of the comments here regarding the expectation of monthly job numbers.
BumRushDaShow
(129,236 posts)regarding "expectations" while ignoring the two I pointed out that have quoted some underlying facts from the data over time, that are indicating some not-so-rosy trends going on.
mathematic
(1,439 posts)And here you are, ASSUMING it is by describing a declining participation rate as "not-so-rosy". Fewer people working because fewer people wanting to work is the opposite of a "not-so-rosy" trend.
I didn't ignore those posts. I put those posts, as well as other posts, in the context of historically low unemployment and an apparent decline in the preference for working. You're responding to me as if I didn't say anything at all. Why don't you tell me how you think the jobs numbers could be higher when only 120k new people a month actually want jobs? Who are these 100s of thousands of new jobs supposed to go to? This data isn't a jobs openings report. It's a jobs report. People need to exist to take potential jobs.
BumRushDaShow
(129,236 posts)I.e., millennials and Xgens, which is the core of the working population. And there may be all kinds of reasons for this including things like "shared living", which then precludes what is essentially the largest living expense - housing...
More adults now share their living space, driven in part by parents living with their adult children
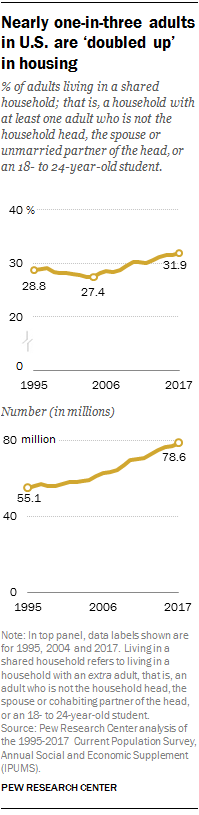
Adults who live in someone else’s household typically live with a relative. Today, 14% of adults living in someone else’s household are a parent of the household head, up from 7% in 1995. Some 47% of extra adults today are adult children living in their mom and/or dad’s home, down from 52% in 1995. Other examples of extra adults are a sibling living in the home of a brother or sister, or a roommate.
In 2017, only 18% of extra adults lived in a household in which the head was unrelated (typically a housemate or roommate). Living with nonrelatives has become less prevalent since 1995, when 22% of extra adults lived with a nonrelative.
Regardless of their relationship to the household head, young adults are more likely than middle-aged or older adults to live in someone else’s household. Among those younger than 35, 30% were the extra adult in someone else’s household in 2017, up from 26% in 1995. Among 35- to 54-year-olds, 12% were living in someone else’s household, an increase from 9% in 1995. Today 10% of 55- to 64-year-olds are an extra adult, up from 6% in 1995. The only adult group that isn’t more likely than before to live in another adult’s household is those ages 75 and older (10% in both years).
The rise in shared living may have implications for the nature of household finances – that is, how income and expenses are shared among members.
https://www.pewresearch.org/fact-tank/2018/01/31/more-adults-now-share-their-living-space-driven-in-part-by-parents-living-with-their-adult-children/
In essence, without the above type of situation going on, the participation rates might be quite different. I.e., in order to afford individual housing, the costs have far exceeded the types of jobs required to buy or rent, forcing people often in that age group, to share housing (or continue to live at home), which inturn reduces the impetus to "participate" (employment wise) outside of 1-off "gig" jobs (as long as there are some shared resources enough to survive).
mahatmakanejeeves
(57,547 posts)From the BLS Twitter account:
See our interactive graphics on today’s #JobsReport http://go.usa.gov/cn5B4 #BLSdata #DataViz
Link to tweet
Understanding BLS Unemployment Statistics … #JobsReport #BLSdata
Link to tweet
More charts and analysis on the July nonfarm payroll employment numbers http://go.usa.gov/4UqY #JobsReport #BLSdata
Link to tweet
* * * * *
If you don't have the time to read anything else, read this. It is what the talking heads will recite on the TV news tonight.
Commissioner's Statement on the Employment Situation
Advance copies of this statement are made available to the press under lock-up conditions with the explicit understanding that the data are embargoed until 8:30 a.m. Eastern Daylight Time.
Statement of
William W. Beach
Commissioner
Bureau of Labor Statistics
Friday, August 2, 2019
Nonfarm payroll employment increased by 164,000 in July, and the unemployment rate was unchanged at 3.7 percent. Notable job gains occurred in professional and technical services, health care, social assistance, and financial activities.
The July increase in payroll employment was in line with the average monthly job gain in the first half of the year (+165,000), but below the average monthly job gain of 223,000 for 2018. (Incorporating revisions for May and June, which decreased employment by 41,000, monthly job gains have averaged 140,000 over the past 3 months.)
....
Among the unemployed, the number of people looking for work for less than 5 weeks rose by 240,000 in July to 2.2 million. This was offset by a decline in the number of people searching for work for 27 weeks or more, which fell by 248,000 to 1.2 million. These long-term unemployed accounted for 19.2 percent of the unemployed.
Both the labor force participation rate, at 63.0 percent in July, and the employment-population ratio, at 60.7 percent, were little changed over the month and over the year.
In July, 4.0 million people were working part time for economic reasons, down by 363,000 over the month and by 604,000 over the year. These involuntary part-time workers accounted for 2.5 percent of the employed in July, down from 2.9 percent a year earlier.
Among those neither working nor looking for work in July, 1.5 million were considered marginally attached to the labor force, essentially unchanged from a year earlier. (People who are marginally attached to the labor force had not looked for work in the 4 weeks prior to the survey but wanted a job, were available for work, and had looked for a job within the last 12 months.) Discouraged workers, a subset of the marginally attached who believed no jobs were available for them, numbered 368,000 in July, down by 144,000 from a year earlier.
In summary, nonfarm payroll employment increased by 164,000 in July, and the unemployment rate held at 3.7 percent.
* * * * *
It used to be that you could get free access to articles in The Wall Street Journal. by going in through TWSJ.'s Twitter account or the Twitter accounts of the authors:
For free access to articles in The Wall Street Journal., try going in through the authors' Twitter feeds:
This trick doesn't seem to work anymore, but you might be able to get in if they've slipped up. Here are those accounts:
* * * * *
The Wall Street Journal.: @WSJ
https://twitter.com/wsj
Wall Street Journal
Breaking news and features from the WSJ.
* * * * *
Ben Leubsdorf: @BenLeubsdorf
https://twitter.com/BenLeubsdorf
I cover the economy at @WSJ. @ConMonitorNews, @AP, @the_herald alum. DC native. Hyperactive news omnivore. Also I like burritos. ben.leubsdorf@wsj.com
* * * * *
Josh Zumbrun: ?@JoshZumbrun
https://twitter.com/JoshZumbrun
National economics correspondent for the Wall Street Journal. Covering the world's usual state of greed and disorder, confusion and apathy. josh.zumbrun@wsj.com
* * * * *
Nick Timiraos: @NickTimiraos
https://twitter.com/NickTimiraos
National economics correspondent, The Wall Street Journal
Please look at the tweets, as Nick Timiraos likes to slice and dice the data every which way. Also, link to the "11 charts " article from his Twitter feed to get past TWSJ.'s paywall.
* * * * *
Jeffrey Sparshott: @jeffsparshott
https://twitter.com/jeffsparshott
Jeffrey.Sparshott@wsj.com
* * * * *
Paul Vigna: @paulvigna
https://twitter.com/paulvigna
Markets, bitcoin, and the zombie apocalypse.
* * * * *
Eric Morath: @EricMorath
https://twitter.com/EricMorath
Eric.Morath@wsj.com
I'm a Wall Street Journal economy reporter, dad, husband and Spartan for life. eric.morath@wsj.com
Washington DC
blogs.wsj.com/economics/
* * * * *
Sarah Chaney: ?@sechaney
https://twitter.com/sechaney
Economy Reporter at The Wall Street Journal. Tar Heel. sarah.chaney@wsj.com
* * * * *

mahatmakanejeeves
(57,547 posts)A) Tariffs are taxes on working class Americans.
B) You can't tax yourself into prosperity.
Link to tweet
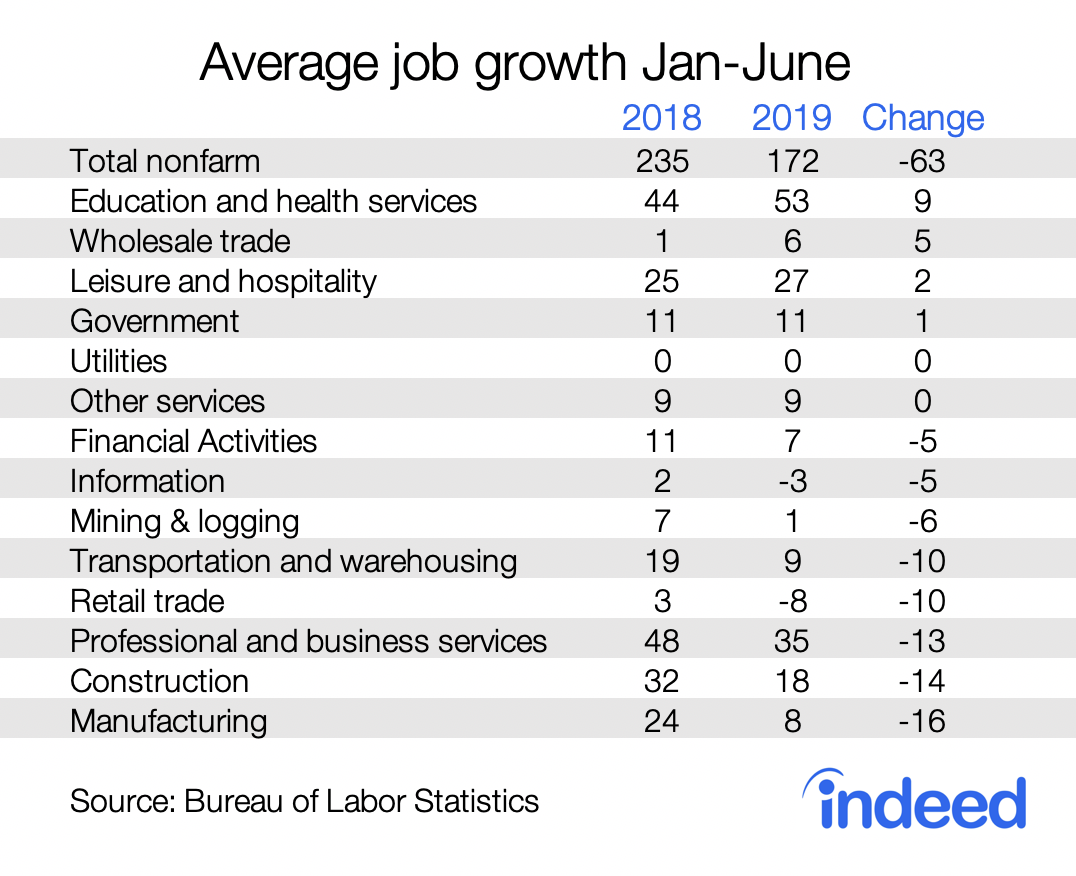
Indeed Hiring Lab
July 2019 Jobs Report: Solid but Not Sensational Job Growth
August 2, 2019 by Martha Gimbel | https://twitter.com/marthagimbel
Jobs Day Preview: With Job Growth Slowing Down, Where Are the Bright Spots?
July 30, 2019 by Martha Gimbel | https://twitter.com/marthagimbel
mahatmakanejeeves
(57,547 posts)CES Preliminary Benchmark Announcement
In accordance with usual practice, the Bureau of Labor Statistics (BLS) is announcing the preliminary estimate of the upcoming annual benchmark revision to the establishment survey employment series. The final benchmark revision will be issued in February 2020 with the publication of the January 2020 Employment Situation news release.
Each year, the Current Employment Statistics (CES) survey employment estimates are benchmarked to comprehensive counts of employment for the month of March. These counts are derived from state unemployment insurance (UI) tax records that nearly all employers are required to file. For national CES employment series, the annual benchmark revisions over the last 10 years have averaged plus or minus two-tenths of one percent of total nonfarm employment. The preliminary estimate of the benchmark revision indicates a downward adjustment to March 2019 total nonfarm employment of -501,000 (-0.3 percent).
Preliminary benchmark revisions are calculated only for the month of March 2019 for the major industry sectors in table 1. The existing employment series are not updated with the release of the preliminary benchmark estimate. The data for all CES series will be updated when the final benchmark revision is issued.
Table 1 shows the March 2019 preliminary benchmark revisions by major industry sector. As is typically the case, many of the individual industry series show larger percentage revisions than the total nonfarm series, primarily because statistical sampling error is greater at more detailed levels than at an aggregated level.
{snip the charts}
Last Modified Date: August 21, 2019
{more editing:}
Start here to see the archival data: Current Employment Statistics - CES (National)
Go over to the left hand side of the page. There's a column of topics. Go down the column:
BROWSE CES
SEARCH CES
CES TOPICS
Under CES TOPICS, click on BENCHMARK.
You'll go to Current Employment Statistics - CES (National) Tables Created by BLS - Benchmark Information
In that category, click on Archived Benchmark Articles
They have .pdfs going back to March 2002.
BumRushDaShow
(129,236 posts)I saw an OP about this too - https://www.democraticunderground.com/10142357662
Happy Hump Day (I think....  )!
)!
mahatmakanejeeves
(57,547 posts)I wanted to be able to find that information all in one place.
Hot, humid, chance of storms - could be just about any day.
Have fun.
BumRushDaShow
(129,236 posts)All the monthly data right here!! 
Heat is supposed to break by Friday. Hope you don't get any tornadoes down there though as I know the beltway area is a hotbed for them. 