General Discussion
Related: Editorials & Other Articles, Issue Forums, Alliance Forums, Region ForumsTemperature chart for the last 11,000 years 
SEP 16 2013
KOTTKE.ORG
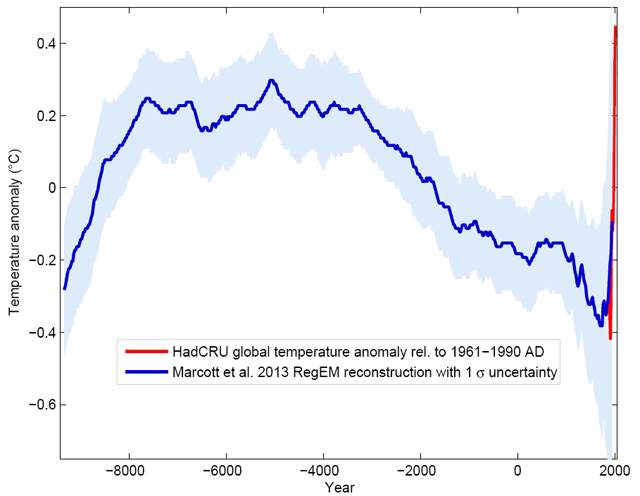
For the first time, researchers have put together all the climate data they have (from ice cores, coral, sediment drilling) into one chart that shows the "global temperature reconstruction for the last 11,000 years":

The climate curve looks like a "hump". At the beginning of the Holocene - after the end of the last Ice Age - global temperature increased, and subsequently it decreased again by 0.7 ° C over the past 5000 years. The well-known transition from the relatively warm Medieval into the "little ice age" turns out to be part of a much longer-term cooling, which ended abruptly with the rapid warming of the 20th Century. Within a hundred years, the cooling of the previous 5000 years was undone. (One result of this is, for example, that the famous iceman 'Ötzi', who disappeared under ice 5000 years ago, reappeared in 1991.)
What on Earth could have caused that spike over the past 250 years? A real head-scratcher, that. But also, what would have happened had the Industrial Revolution and the corresponding anthropogenic climate change been delayed a couple hundred years? The Earth might have been in the midst of a new ice age, Europe might have been too cold to support industry, and things may not have gotten going at all. Who's gonna write the screenplay for this movie? (via @CharlesCMann)
more
http://kottke.org/13/09/temperature-chart-for-the-last-11000-years
Uncle Joe
(58,372 posts)Thanks for the thread, n2doc.
Curmudgeoness
(18,219 posts)Well, unless you don't believe in science.
That is a scary chart, and since anyone who does believe in science realizes that the warmer it gets, the more icecap we lose, and the more we warm up. I have a feeling that we are beyond the turning point and had better figure out how to survive on a hot planet.
cantbeserious
(13,039 posts)Sarcasm - Sarcasm - Sarcasm
pampango
(24,692 posts)Climate change denial by republicans is a classic example but there are many others.
Curmudgeoness
(18,219 posts)stoning people committing adultery is not acceptable anymore, even though it is commanded in the Bible, but homosexuality is still an abomination because it is in the Bible....or so they say.
I guess if you are an adulterer, you shy away from all that punishment stuff.
LuvNewcastle
(16,847 posts)give up their cars, ride bicycles, and become gay, just like the Europeans.
sarisataka
(18,679 posts)there is no other indication of such a radical change of temperature in so short of time in the geologic record; so if it is not a natural anomaly...
Spitfire of ATJ
(32,723 posts)With no end in sight.
Even TALKING about it means risking the black lung electoral votes.
Celefin
(532 posts)It kicked in after the second world war for a whole host of reasons.
This graphic here is great (compressed jpg.file) - it shows that red spike reflected in a lot of different things going on on earth.
http://www.anthropocene.info/assets/files/files-4.zip
From a very nice new website:
http://www.anthropocene.info/en/home
I've worked with a few of the people who have done the science the site is based on.
Inspiring characters.
Motown_Johnny
(22,308 posts)We go from 1 BC to 1 AD with no 0 in between.
So clearly this is all a hoax
![]()