Welcome to DU! The truly grassroots left-of-center political community where regular people, not algorithms, drive the discussions and set the standards. Join the community: Create a free account Support DU (and get rid of ads!): Become a Star Member Latest Breaking News General Discussion The DU Lounge All Forums Issue Forums Culture Forums Alliance Forums Region Forums Support Forums Help & Search
Honeycombe8

(37,648 posts)
Fri Oct 26, 2012, 03:36 PM Oct 2012

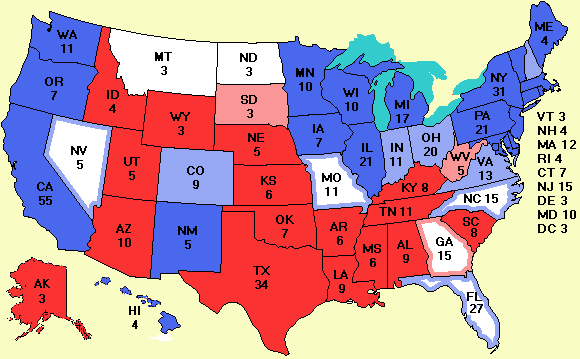
10/26/2008 Electoral Map fr polls vs. Election Results vs. 10/26/2012 Electoral Map

Last edited Fri Oct 26, 2012, 06:10 PM - Edit history (2)


The electoral map on this date in 2008 ended up being pretty close to actual election results. First is the electoral map on 10/26/2008, followed by the actual 2008 election results. VERY CLOSE. Followed by the 10/26/2012 electoral map. If history repeats itself, this bodes well for an Obama win.


http://electoral-vote.com/evp2008/Pres/Maps/Oct26.html

Obama 375........McCain 157......Ties 6


ACTUAL ELECTION RESULTS AND MAP:
Obama 365....McCain 173


http://politicalmaps.org/maps-of-the-2008-us-presidential-election/


ELECTORAL MAP TODAY, OCTOBER 26, 2012:

Obama 284....Ties 34......Romney 220


2 replies = new reply since forum marked as read
Highlight: NoneDon't highlight anything 5 newestHighlight 5 most recent replies
10/26/2008 Electoral Map fr polls vs. Election Results vs. 10/26/2012 Electoral Map (Original Post) Honeycombe8 Oct 2012 OP
No interest in this? I thought it was pretty awesome. Honeycombe8 Oct 2012 #1
It's awesome! warrior1 Oct 2012 #2
Latest Discussions»General Discussion»10/26/2008 Electoral Map ...