Welcome to DU!
The truly grassroots left-of-center political community where regular people, not algorithms, drive the discussions and set the standards.
Join the community:
Create a free account
Support DU (and get rid of ads!):
Become a Star Member
Latest Breaking News
General Discussion
The DU Lounge
All Forums
Issue Forums
Culture Forums
Alliance Forums
Region Forums
Support Forums
Help & Search
General Discussion
Related: Editorials & Other Articles, Issue Forums, Alliance Forums, Region ForumsVia Krugman, this chart illustrates Mitt's problem when it comes to the economy
Economic Fundamentals and the Election
<...>
Here’s a comparison I haven’t seen made: the unemployment rate in Ohio under two administrations:

Unemployment was still very high in Ohio at this time in the Reagan years. But it was coming down, and most people blamed the previous administration for the surge in unemployment that had occurred before.
And you could say exactly the same thing this time around, with the added twist that much of the good news can be attributed to the auto bailout that Obama carried out in the face of frantic GOP opposition.
Now, national sentiment matters too, and Obama obviously can’t run a campaign on boosterism. But the key point is that the economic background isn’t that bad for him politically; it’s good enough, in particular, for him to try to turn this into a “choice” election that his opponent clearly wasn’t ready for.
http://krugman.blogs.nytimes.com/2012/09/12/economic-fundamentals-and-the-election/
<...>
Here’s a comparison I haven’t seen made: the unemployment rate in Ohio under two administrations:
Unemployment was still very high in Ohio at this time in the Reagan years. But it was coming down, and most people blamed the previous administration for the surge in unemployment that had occurred before.
And you could say exactly the same thing this time around, with the added twist that much of the good news can be attributed to the auto bailout that Obama carried out in the face of frantic GOP opposition.
Now, national sentiment matters too, and Obama obviously can’t run a campaign on boosterism. But the key point is that the economic background isn’t that bad for him politically; it’s good enough, in particular, for him to try to turn this into a “choice” election that his opponent clearly wasn’t ready for.
http://krugman.blogs.nytimes.com/2012/09/12/economic-fundamentals-and-the-election/
InfoView thread info, including edit history
TrashPut this thread in your Trash Can (My DU » Trash Can)
BookmarkAdd this thread to your Bookmarks (My DU » Bookmarks)
5 replies, 1329 views
ShareGet links to this post and/or share on social media
AlertAlert this post for a rule violation
PowersThere are no powers you can use on this post
EditCannot edit other people's posts
ReplyReply to this post
EditCannot edit other people's posts
Rec (8)
ReplyReply to this post
5 replies
 = new reply since forum marked as read
Highlight:
NoneDon't highlight anything
5 newestHighlight 5 most recent replies
= new reply since forum marked as read
Highlight:
NoneDon't highlight anything
5 newestHighlight 5 most recent replies
= new reply since forum marked as read
Highlight:
NoneDon't highlight anything
5 newestHighlight 5 most recent replies
Via Krugman, this chart illustrates Mitt's problem when it comes to the economy (Original Post)
ProSense
Sep 2012
OP

ProSense
(116,464 posts)1. Kick! n/t

MissMarple
(9,656 posts)2. Now there you go with those facty things.

ProSense
(116,464 posts)3. There are differences,
but one thing is clear: The efforts by the Obama administration set the country on a path to recovery.
Snapshot last four recessions
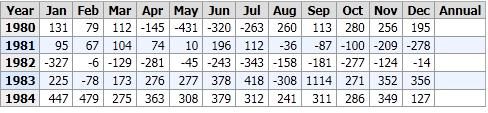
Consecutive job losses August 1981 to December 1982: 17 months, -2.8 million jobs.
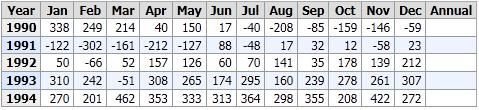
Job losses/weak gains April 1990 to September 1992: 30 months, -723,000 jobs
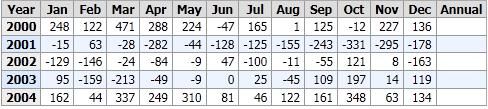
Job losses/weak gains June 2000 to December 2003: 43 months -1.6 million jobs.
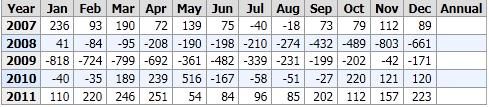
Consecutive job losses February 2008 to February 2010: 25 months, -8.8 million jobs
Years can be pluged in here: http://data.bls.gov/timeseries/CES0000000001?output_view=net_1mth
This was the worst recession in 70 years, and Republican obstruction is not helping.
MissMarple
(9,656 posts)5. I love facty things, but this might do better in good reads or politics 2012

ProSense
(116,464 posts)4. Another! n/t