Welcome to DU!
The truly grassroots left-of-center political community where regular people, not algorithms, drive the discussions and set the standards.
Join the community:
Create a free account
Support DU (and get rid of ads!):
Become a Star Member
Latest Breaking News
General Discussion
The DU Lounge
All Forums
Issue Forums
Culture Forums
Alliance Forums
Region Forums
Support Forums
Help & Search
General Discussion
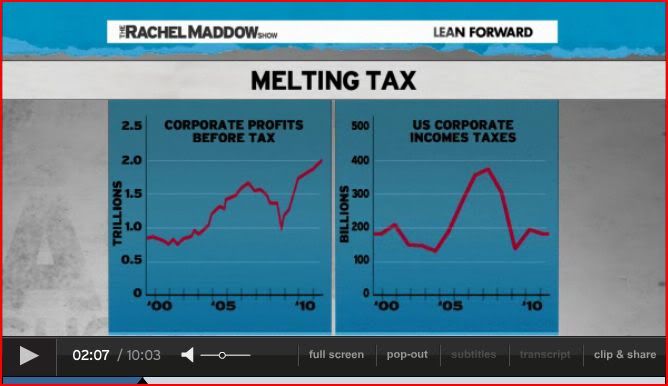
Related: Editorials & Other Articles, Issue Forums, Alliance Forums, Region ForumsGraphic from Rachel last night: Corporate profits vs corporate tax revenues
Too good to miss...
[IMG]
 [/IMG]
InfoView thread info, including edit history
TrashPut this thread in your Trash Can (My DU » Trash Can)
BookmarkAdd this thread to your Bookmarks (My DU » Bookmarks)
5 replies, 1240 views
ShareGet links to this post and/or share on social media
AlertAlert this post for a rule violation
PowersThere are no powers you can use on this post
EditCannot edit other people's posts
ReplyReply to this post
EditCannot edit other people's posts
Rec (9)
ReplyReply to this post
5 replies
 = new reply since forum marked as read
Highlight:
NoneDon't highlight anything
5 newestHighlight 5 most recent replies
= new reply since forum marked as read
Highlight:
NoneDon't highlight anything
5 newestHighlight 5 most recent replies
= new reply since forum marked as read
Highlight:
NoneDon't highlight anything
5 newestHighlight 5 most recent replies
Graphic from Rachel last night: Corporate profits vs corporate tax revenues (Original Post)
Scuba
Jan 2012
OP
Thanks. Just noticed "profits" graph is "TRILLIONS" while taxes (paid?) is "billions"!!
FailureToCommunicate
Jan 2012
#2

RUMMYisFROSTED
(30,749 posts)1. The big drop in tax revenue starts in '09.
And the profits begin to soar then, too.
I wonder what it means? ![]()

FailureToCommunicate
(14,023 posts)2. Thanks. Just noticed "profits" graph is "TRILLIONS" while taxes (paid?) is "billions"!!
But, heck, corporations are just 'people...helping people' as the Mittster likes to say...
Scuba
(53,475 posts)3. Thanks for bringing that to the forefront. n/t

bighart
(1,565 posts)4. Actually taxes are in billions not millions.
Last edited Fri Jan 6, 2012, 11:02 AM - Edit history (1)
Just for clarity.
Heard a report on NPR this morning about return on investment for lobbying dollars spent by corporations over the last few years (including 2010 and 2011, I believe the figure was 2200%
FailureToCommunicate
(14,023 posts)5. Right. Fixed it.