Democratic Underground Latest Greatest Lobby Journals Search Options Help Login
Google

Stimulus graphic that shows the success:

Printer-friendly format Printer-friendly format
Printer-friendly format Email this thread to a friend
Printer-friendly format Bookmark this thread
This topic is archived.
Home » Discuss » General Discussion: Presidency Donate to DU
 
MidwestTransplant Donating Member (1000+ posts) Send PM | Profile | Ignore Wed Feb-17-10 11:16 AM
Original message
Stimulus graphic that shows the success:
Edited on Wed Feb-17-10 11:56 AM by MidwestTransplant
Printer Friendly | Permalink |  | Top
tridim Donating Member (1000+ posts) Send PM | Profile | Ignore Wed Feb-17-10 11:22 AM
Response to Original message
1. The anti-Obama DU'ers will be here shortly to poop on this data.
I can't wait. :eyes:
Printer Friendly | Permalink |  | Top
 
Milo_Bloom Donating Member (1000+ posts) Send PM | Profile | Ignore Wed Feb-17-10 11:44 AM
Response to Reply #1
3. So sorry you have to deal with reality sometimes.
Printer Friendly | Permalink |  | Top
 
tridim Donating Member (1000+ posts) Send PM | Profile | Ignore Wed Feb-17-10 11:58 AM
Response to Reply #3
6. The graphs are the reality.
Do you disagree with the data? If so, why?
Printer Friendly | Permalink |  | Top
 
Milo_Bloom Donating Member (1000+ posts) Send PM | Profile | Ignore Wed Feb-17-10 03:11 PM
Response to Reply #6
7. The reality and the graphs are pretty grim.
I don't disagree with the data t all. I know people desperately want to be happy about things, but the graphs are really just spin.

GDP and the stock market are easily manipulated with government spending.. Reagan and Bush proved that, but the probablem has always been the rate of acceleration of GDP is LESS than the rate of acceleration to the debt. In short, you can't keep up the pace! They key has always been to spend money such that it makes you MORE MONEY down the line or rig a system that will do just that.

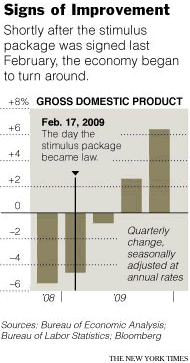
Unfortunately, the middle graph really tells the story, we are still dealing with an INCOME LOSS, despite increased spending.. in short, some jobs may have been TEMPORARILY saved and some new jobs may have been TEMPORARILY created, but there is a net loss.. which means less income to the government in the future.

Strangely, what could really help this economy is cap and trade, as it will create a new bubble, which would create an influx of money... then we would have to spend that money smartly.

Under Clinton the internet bubble was created.. this was done mainly via de-regulation of wall-street, followed by wild speculation in a new medium. It allowed the average joe to make a quick buck and suddenly have extra cash and it also infused the government with larges amounts of extra cash, creating a surplus. Had idiot son not come along and pissed it away, that surplus could have been used wisely to keep us from ever going into a recession and created a more stable economy. The only reason we didn't plunge into a bigger recession at the beginning of bush's presidency was because he spent the money, but he spent it stupidly, so it had no long last effect... The idiot then helped to inflate the next bubble, which was really planned and started under Clinton, but taken to rediculous new heights under idiot... however, unlike Clinton, idiot didn't save the money from the new bubble (the housing bubble), but instead squandered it... so we wind up with a collapse and a huge debt on top of it.. aka BIG ASS RECESSION.

So enter the stimulus... Right now the spending is NOT PAYING FOR ITSELF and NOT SUSTAINABLE and the graphs really prove that fact because there is not a net gain in jobs... lots spent, less income... not a working plan.

Let's see if they actively push for Cap and Trade, b/c that could be just the bubble we need.. but they need to ACT FAST, because if it comes too late.. the GOP will likely get credit for "recovery" which will really be just a bubble and then squander the cash and lead us into a depression.
Printer Friendly | Permalink |  | Top
 
Clio the Leo Donating Member (1000+ posts) Send PM | Profile | Ignore Wed Feb-17-10 11:22 AM
Response to Original message
2. Thanks for posting that....
.... handy dandy graphs to share with friends and coworkers.
Printer Friendly | Permalink |  | Top
 
zulchzulu Donating Member (1000+ posts) Send PM | Profile | Ignore Wed Feb-17-10 11:53 AM
Response to Original message
4. I animated the graphic to show the comparison


Printer Friendly | Permalink |  | Top
 
MidwestTransplant Donating Member (1000+ posts) Send PM | Profile | Ignore Wed Feb-17-10 11:55 AM
Response to Reply #4
5. Nice. Wish I could do that!
Printer Friendly | Permalink |  | Top
 
FrenchieCat Donating Member (1000+ posts) Send PM | Profile | Ignore Wed Feb-17-10 03:18 PM
Response to Reply #4
8. Thanks for that. I'm saving it!
:hi:
Printer Friendly | Permalink |  | Top
 
DU AdBot (1000+ posts) Click to send private message to this author Click to view 
this author's profile Click to add 
this author to your buddy list Click to add 
this author to your Ignore list Sat May 04th 2024, 07:05 AM
Response to Original message
Advertisements [?]
 Top

Home » Discuss » General Discussion: Presidency Donate to DU

Powered by DCForum+ Version 1.1 Copyright 1997-2002 DCScripts.com
Software has been extensively modified by the DU administrators


Important Notices: By participating on this discussion board, visitors agree to abide by the rules outlined on our Rules page. Messages posted on the Democratic Underground Discussion Forums are the opinions of the individuals who post them, and do not necessarily represent the opinions of Democratic Underground, LLC.

Home  |  Discussion Forums  |  Journals |  Store  |  Donate

About DU  |  Contact Us  |  Privacy Policy

Got a message for Democratic Underground? Click here to send us a message.

© 2001 - 2011 Democratic Underground, LLC