From: http://www.scoop.co.nz/stories/HL0706/S00165.htm 
Scoop American Coup II is deeply honoured to present...
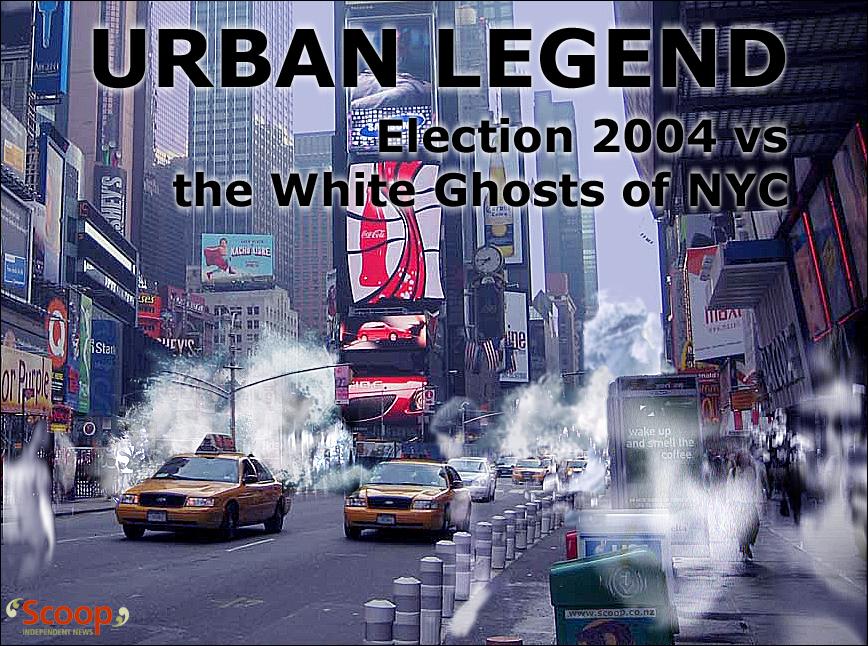
Election 2004: The Urban Legend
Michael Collins
�Scoop� Independent News
This analysis is based on original, unpublished research by web commentator, anaxarchos, to whom I owe a debt of gratitude 
See also companion article� Sludge Report #177 � Bigger Than Watergate II"The night of November 2, 2004, was exhilarating or devastating, depending on how you voted and where you were. If you were a rural conservative who voted based on your religious affinity to Bush, you were elated. You were also relieved, because your peers had not turned out with the same enthusiasm that they had shown in 2000. If you were in the suburbs and had campaigned hard for Kerry, you were probably devastated. After all that work in your first campaign ever, the big crowds and the optimistic polls, your man lost. But if you were white, living in a large city, and probably a returning voter after missing several elections, you were positively exuberant. You and your like-minded peers continued George W. Bush�s reign as the 43rd President of the United States. It was a miracle.
This election was a sight to see. Few in the country had the vantage point of network news commentators. Throughout the day these experts received a stream of information from the exit polls of the National Election Pool (NEP). Sponsored by a media consortium consisting of the four major television networks plus CNN and the Associated Press, the NEP provided the most sophisticated polling data ever.
The pundits had the national Exit Poll of 13,660 respondents
(1) and parallel State Exit Polls of over 77,000 respondents. The NEP was the only source on �
who voted for each candidate;
why the voters in each area made critical choices; and
where geographical differences on candidates and issues were a factor.�
If you paid attention and knew your craft, you were on fire. Election 2004 was the best thing to happen since Truman beat Dewey and you probably weren�t around for that. It was a unique moment. Just a day or two after the election, experienced analyst Charles Cook practically gushed after he studied the exit polls saying the Bush effort was ��unquestionably �the best planned, best executed presidential campaign ever.�
(2) Based on what he knew at the time, this made sense. Cook reflected that, �Perhaps the most interesting, and maybe
puzzling,
exit poll finding is that (compared to 2000) Kerry lost 11 points among the 13 percent of Americans who live in cities with populations over 500,000, while President Bush jumped up 13 points (since 2000).� He concluded that the surprising urban performance, required for a Bush win, was a result of defections from the Kerry camp by black, Latinos, and Jewish voters. This is the stuff of legends.
Cook�s analysis pinpointed the actual location the Bush victory: urban voters. His mistake was to think that the normal Democratic constituencies in the cities did anything different from what they had always done. Cook himself was one of a few who actually saw and understood the critical role large cities played in providing the Bush victory margin.
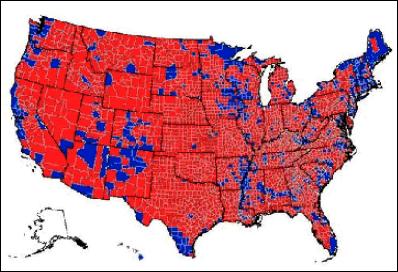
The Conventional WisdomOn election eve, a different story prevailed. While they had access to the same exit polls that Cook had, the news people did not notice the same trends and numbers that Cook noticed. Network anchors and others talked about the red-
versus-blue battle. There were the very red rural evangelicals, almost all white. The media rolled out the newly minted �security moms� in the purple suburbs plus the true blue Democrats in our largest cities, a predictable group if there ever was one. Unlike Cook, who studied the exit polls, the popular news casters assumed that the Rove strategy had materialized.
It was all about country versus city, red versus blue and
sotto voce white versus non white. They were right about an election; but
that election had taken place four years earlier. The public received a regurgitation of election 2000 analysis for 2004. The follow up consensus was formed from this inaccurate analysis. The remarkable Rove had done it again with those energized evangelicals. And, he�d grabbed enough van driving suburban moms to make the difference.
USA Today
(3) echoed much of the analysis when they concluded their election wrap up with this insight:
In the end, the states broke for Bush much as they did in 2000. Bush lost one state that he won in 2000: New Hampshire. Late Wednesday, the Associated Press reported New Mexico went to Bush. Iowa was still undecided. Both states backed Gore in 2000. (4)
During the week or so after Election Day, there were additional flourishes added to the portrait of Bush�s remarkable victory. He had captured the
values voters, a new demographic. These voters cast aside their normal allegiances and turned red in a full embrace of the values of the administration. According to the National Exit Poll, Bush supposedly achieved another remarkable feat. He moved the Latino vote from a Democratic mainstay to a competitive playing field. Unlike the typical 60-40% margins Democrats counted on, in 2004 Latino votes were divided 54% - 46%, a 12 point swing. These two additional �findings� hinted at but did not address directly the Bush urban wave.
There was no broad public debate on the legitimacy of the outcome. Intensive debate on the Internet was stimulated by accidental release of preliminary exit poll data throughout Election Day which showed Kerry winning 51% to 48%. Totaling over 11,000 respondents, these polls were marked �Not for on air use.� This fueled charges of election fraud due to the winning margin for Kerry in all exit polls but the final released on the day after the election. In addition, the debate focused on what was called the
red shift, Bush victory in a number of key states, all of which were said to be outside the margin of error for the poll. Aside from these interesting but largely ignored exchanges, Americans settled in for four more years of George Bush.
**************************************** The National Election Pool (NEP) and has been a feature of recent American political life. The polling company which conducts these surveys describes their purpose as follows:
Exit polls / voter surveys are taken only minutes after citizens� vote. The results are primary sources from which we can understand the motivations and patterns behind the actual vote. Exit Polls Tell Us: WHO voted for each candidate; WHY voters in your area made critical choices; WHERE geographical differences on candidates and issues were a factor. Edison-Mitofsky Web site 03 May 2007
We use the final revised national exit poll issued the afternoon of Nov. 3, 2004 for this analysis. All of the charts and figures presented come from the 2000 and 2004 National Exit Polls except those at the very end of the essay, where the alternate source is clearly marked.
See also Appendix 2**************************************** Is this what actually happened?According to the final National Exit Poll, there was a lot more to the 2004 election than Red versus Blue.
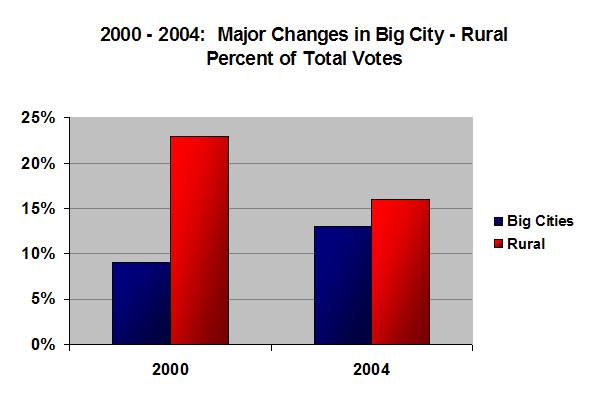
FIGURE 1. The 2004 rural vote must have alarmed the Bush camp. It was less as a percentage of the overall vote, dropping from 23% to 16%. Bush�s total rural vote went from 14 million in 2000 to just short of 12 million in 2004. These totals added up to a devastating loss of 2 plus million votes from his base instead of an increase by the 3 to 4 million the campaign needed. This was very bad news for the White House. Their core rural base was absent without leave.
Bush scored a huge victory margin in 2000 in rural America. The 2004 narrative was that the Red versus Blue contest was also the basis for the 2004 victory. But in 2004, rural America provided fewer voters and fewer votes for Bush. Sure, he won the rural segment of the population but this was hardly a victory in comparison to 2000. What happened to the wave of born again Christians supposedly so loyal to Bush? Did they stay home? Did they vote by not voting, a time honored American practice? Did they sit out this most critical of elections despite their spirited performance in 2000 and the exhortations from pulpits, televisions, and over the phone?
We need to put our narrative on pause for a moment and interject a note of ugly reality. In a high turnout election, a presidential candidate who loses a big chunk in his base constituency loses the election. This is axiomatic. There are no exceptions in modern election history. The loss of his core constituency through a drop from 23% to 16% of total vote share was bad enough. In addition, according to the NEP, Bush lost expected votes. At 23% of the vote in 2000, Bush had 14.1 million rural votes. At 16% of the vote in 2004, the rural segment provided only 11.6 million votes. This is an absolute loss of 2.5 million votes in an election that had a 16% increase in turnout compared to 2000.
We are now faced with an incredible situation. Bush won the election according to the declared vote count. Yet he did so with his core constituency on strike: fewer votes from his core constituency in actual terms and fewer votes as a percentage of total votes. It is important to keep this in mind as we move forward because the novelties compound one upon another to present an outcome that is simply not believable.
Bush also lost significant ground in the �small towns,� the other element of his values coalition. Small towns are defined as towns of 10 to 50 thousand residents.
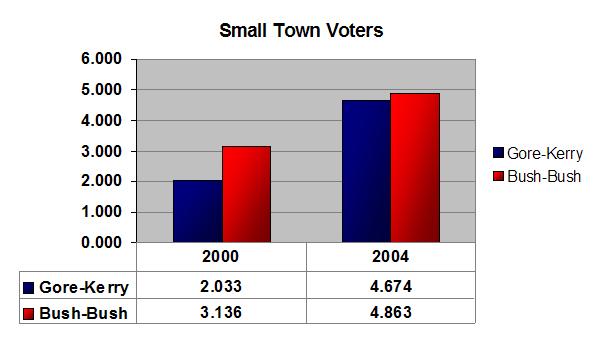
FIGURE 2. In 2000 Bush owned small town America. In small towns, he beat Gore 60% to 40% and walked off with a 1.0 million vote margin. In 2004, turnout increased dramatically, but the race evened with the Bush margin at just below 0.2 million votes. Were these the real values voters? This shows even further erosion of the Bush 2000 base.
The small towns were the other significant part of the Bush
�base�. While many rural voters expressed their disenchantment, according to the Exit polls, by staying home, the citizens of small towns increased their turnout by 88% in 2004 and evened the playing field by voting in near equal numbers for John Kerry. Bush had 4.9 million small town votes to Kerry�s 4.7 million for a total of 9.5 million. Small towns had given 2000 to Bush over Gore by 3.1 to 2.0 million votes.
The suburbs were only somewhat better for Bush in 2004 than in 2000. His victory margin there was 5% over Kerry, where it had been just 2% above Gore�s 2000 effort. The suburbs comprise nearly half of the total votes.
Bush took 28.3 million to Kerry�s 25.6 million votes. But, it was not nearly enough. Given the decay in the rural and small town margins and the historical Democratic margin in the cities (the �blue� on the election maps), the 2004 Presidential contest was as good as lost for Bush.
Now, however, the exit poll narrative changes. According to the polls, Bush made very surprising gains in the smaller cities, those with populations between 50 and 500 thousand. There Bush trailed Gore by 17 points in 2000, 8.4 million to 12.0 million respectively. In 2004, the smaller cities were almost even with Kerry at 11.36 million and Bush at 11.39 million. Turnout was up just 9%. It is very difficult to explain such a �trend�. Nevertheless, taking the rural voters, the suburbs, and the break even smaller cities as a group, we see that Bush was still in real trouble heading into the larger cities. Had Kerry just held Bush close to the Gore big city margins for 2000 in these Democratic friendly venues, he would have won the election.
Why not expect a strong Kerry showing? Bush had not been a city-friendly President and he had not gone out of his way to help large cities with any initiatives of note. In our largest city, New York, things looked particularly bad. A 2003 poll showed that over 50% of the residents thought that the administration had foreknowledge of the 911 attacks and did nothing, hardly a predictor of great success in that largest of large cities.
But something very unusual happened, as Charles Cook pointed out. According to the NEP, Bush made incredible gains in the cities over his 2000 vote share. These gains were large enough to offset his drop in core support in rural areas and give him a 3% victory.
In addition, big city voters must have been �motivated� by something. Compared to 2000, rural turnout was down 2.0 million, small towns up sharply at 88% (yet still a small segment), and suburban turnout up slightly, with the smaller cities showing a modest increase which was still less than the reported national average. Turnout in cities over 500 thousand in population increased by 66%. What was this all about?
The answer to that question and the plausibility of the answer to that question is vital in understanding the story we were told of the 2004 election results.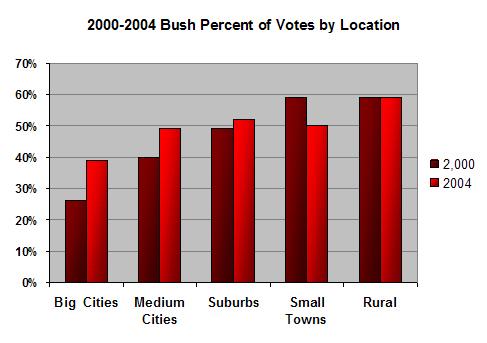
FIGURE 3. We are expected to believe that after doing poorly in the rural area and small towns, Bush attracted several million new big city voters and pulled off a last minute victory. In the small towns he was well below his 2000 performance for total votes. In the �red� zone, rural America, he got fewer votes in 2004 than he did in 2000 while turnout was up across the nation.
Bush didn�t win the cities. He didn�t have to, he was already winning. Ultimately he had to achieve a better split in the big cities than he had in 2000. Looking at the chart above, you see the increase in Bush votes in the five location categories.
According to the vote totals, the real kill shot for the Bush victory came from large urban areas, �big cities�, defined as those with a population of half a million or more, e.g., New York, Chicago, Detroit, etc. These cities had been the strongest base for Democrats since the Great Depression. There had been variations in turnout from presidential election to election, but the margins had always remained strong.
The Bush Urban Wave of 2004 by the NumbersThe most instructive way to look at the remarkable and certainly unpredictable Bush urban wave is to take his cumulative margin starting with the rural areas and moving to progressively more dense population areas ending up with the big cities.
Bush started out with a 5.0 million vote margin in rural America in 2000 when 105 million votes were cast. With 122 million cast
in 2004, his core constituency gave him only a 3.9 million margin by comparison. There were 23.8 million votes cast in the rural segment in 2000 and just under 20 million in 2004. In fact, given the very high rural turnout rates from 2000, it would have been unlikely that the total margin could increase in 2004.
Towns with a population or 10 to 50 thousand accounted for 5.0 million votes in 2000 with Bush taking this group 60 - 40% over Gore. Votes totals reached nearly 10 million and there was a 48% Kerry - 50% Bush split. These added just 175 thousand votes to the
accumulated margin for Bush. In 2000, Bush added 1.1 million votes to his margin for this segment.
At this point things were looking grim for George W. Bush. His rural base stayed home and small town voters nearly doubled their 2000 vote totals and split even. After these Republican core area totals, he was up by 4 million votes. In 2000, at this juncture, he had been up 6.3 million votes with a smaller electorate.
The suburbs, the largest voting block, showed slight improvement for Bush. He increased his 2000 victory margin there from two to five percent and the suburban share went from 43% to 45%. Yet his cumulative margin at this juncture was 6.8 million compared to 7.3 million in 2000 and there were many more Americans yet to vote.

Figure 4. Graph reads from left to right, e.g., 2004 3.8 million rural lead in rural areas; adding the small town margin, Bush has only 4.0 million cumulative - net lead when 2004 small town votes are factored in. This shows that Bush �won�, not by building up a huge lead that was eroded in urban areas, but by building up a much smaller lead that was not nearly as dramatically �eroded� in the cities.
Gore had fared worse than Kerry by a long shot in Rural and Small Town America but then broke even in the suburbs. Once he hit the smaller and big cities, Gore was on a roll and pulled out the forgotten half million popular vote victory.
In 2004, Bush struggled in the rural and small town segments. He gained a modest advantage in the suburbs. Things weren�t looking good compared to his 2000 performance.
Then the urban wave began to form. According to the final exit poll, despite being abandoned by his 2000 base, which was specifically targeted for even more votes in 2004, Bush rallied in the smaller cities. He went from a loss of 60%-40% in 2000 to a dubious break even in 2004. Instead of an inadequate 3.8 million advantage in 2000, Bush went downtown, so to speak, with a seemingly staggering 6.8 million vote advantage over Kerry.
Remarkably, that was not going to be enough for a Bush win. Had Kerry maintained the Gore big city margin of 2000 with the 60% increase in turnout, he would have won the election easily, both numerically and in terms of electoral votes. And why wouldn�t he maintain that margin? Bush was indifferent to the big cities and there was little campaign activity there; the turnout increase in the NEP was huge, from 9.2 million to 15.2 million. These people must have been motivated. Kerry was on deck with a big bat against a weak opposing team.
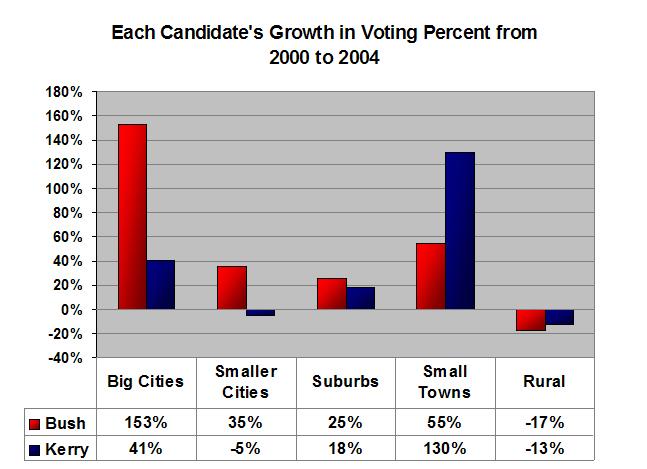
Figure 5. Unprecedented! That�s the only word necessary to show the dichotomy of 2004 � Bush losing actual votes in his base, rural America, while gaining an exponential increase in big cities.
But something happened. The Urban Legend appeared in the form of a tidal wave of increased Bush support. While his rural, conservative, white, Christian voters were staying home or changing candidates, it seemed that his appeal to urban voters went off the charts. He increased from 26% to 39% of the big city vote total, from a 2.7 million total in 2000 to 5.9 million total votes in 2004. What was happening? The urban legend was born.
Who would have thought?Who would have thought that the margin for the Bush victory would come from cities, particularly America�s largest cities, those with over 500 thousand people? In truth, it did because �it had to�. The red base, rural America, could not match its relative performance in 2000 relative to a 19% increase in the total vote. In fact, the base receded. Small towns showed major increases in turnout but that benefited Kerry; surprisingly, he broke even there. The suburbs were slightly improved but Bush turnout was not spectacular. The smaller cities, population 50 to 500 thousand, had only a 9% increase in turnout over 2000.
But voters were hitting the streets of the big cities, with a 66% increase in turnout. That meant only one thing as preliminary exit poll data was reviewed throughout Election Day: the end of the road for G.W. Bush.
According to the Exits Polls, something was happening in the big cities and it was happening in a big city way. For every 100 voters returning from 2000 there were 66 new voters showing up at polls to vote. Without any doubt, these voters were the most motivated block segment compared to a 9% increase in the smaller cities, a 19% in the suburbs and a decrease in rural turnout of 17%. Only the small towns, a much smaller segment, had close to this level of turnout.
Running behind his 2000 totals in his base area, Bush had little hope until the returns from the cities came in. The smaller cities had moved from a 57% to 40% split for Democrats in 2000 to break even in 2004. This was no slight accomplishment. Bush picked up 3.0 million votes over his 2000 total. Turnout for this segment was up only 1.8 million votes.
But that was nothing compared to the big cities. Here we have voters who are typically referred to as the core Democratic constituency. These were the people that the Democrats would always count on and who the Republicans used as surrogates to rally their mostly white suburban and rural base. Turnout was up 60%, the big city share of the national vote total was up 25%, but there was an entirely new voting pattern.
After four years of national struggle and focus overseas, inner city Americans came to the polls in record numbers, voted more Republican than before or since, and gave George Bush the necessary votes for his victory in 2004!Is this Pattern Plausible or even Possible?Accepting this strange event requires accepting that an election without any precedent occurred. The Democrats have seen retreats in urban turnout and vote share but these have
never been accompanied by retreats in the Republican base area. The two phenomena just don�t happen in the same election. Democrats increased their votes in a diminished rural voting block, significantly improved performance in the small towns, and held close in the suburbs. They were taking three out of every five new voters around the country - but then we are expected to believe that they lost the election in the big cities after taking a similar beating in the smaller cities. This combination of events has never happened before in American history. It is unprecedented� and unbelievable.
An Urban Legend or a Potemkin VillageTo understand the real explanation of the urban legend of 2004, we need to look for any election efforts aimed at big city voters. What stimulated the big turnout increase and what pushed returning or new voters into the Republican camp?
If this Bush urban wave actually materialized, you would expect a general and a proximate cause. The general cause would have come in the form of an issue(s) that moved voters to such a degree that they either they switched decades old party loyalty or candidate preference held sway over party loyalty.
The proximate cause would show up as big city activity focused on
get out the vote (GOTV) efforts combined with advertising and major campaign events. Noticeable campaign efforts would have been essential. How could Bush make huge gains in admittedly hostile territory with out these efforts?
The general cause would have come in the form of a city-friendly charismatic Republican incumbent. We�d expect to see Bush in the cities laying on the charm, so to speak, and announcing a few high profile federal projects.
There is no apparent general cause for a shift in loyalties and voting in big cities. Unlike Ronald Reagan, who emphasized big city enterprise zones, Bush seemed indifferent to the needs of urban dwellers. Bush was not a city type of guy and rarely went to New York, Chicago, or Los Angeles for anything other than high level events. Not big on mixing with the masses, he demonstrated a clear preference for the solitary activity of clearing trees and brush from the Texas ranch he acquired just before the 2000 primaries. To the extent that 911 sensibilities may be considered, they seem to have been a far larger factor in the suburban than in the urban vote, at least as far as the exit polls indicate.
As for the proximate causes needed to turn opinion and attitude into an actual voting experience for the converted, they were certainly not evident. The Republican focus was always on ramping up the rural base and increasing the suburban vote. We found little if any comment in the Republican media machine about push polls, new programs for or special events in big cities to drive the vote. Bush gave speeches around the country, but you often needed a ticket to attend. Think back to any Bush big city rallies or events; rare and not a priority. Big city strategy was not a featured item in the 2004 Republican playbook.
How do we know this? To begin with, the core Democratic blocks in big cities didn�t change their votes according to the National Exit Polls. The NEP showed that black, Latino, and Jewish city voters went for Kerry at rates of 95%, 66%, and 80%.
The National Exit Poll gathers data each year on various campaign activities. The vital activity accompanying any significant vote increase is called GOTV - get out the vote. According to the NEP, only 1 in 10 urban residents contacted received Republican GOTV calls. Media buys in big cities were not even close to those in the suburbs where Bush only netted an extra 3% vote share over 2000, and campaign events for these urban groups were virtually non existent.
Scrutiny of the National Exit Poll was not the focus on election night. Hurried analysts looked at the vote totals coming in and offered explanations that we now know were not even remotely accurate. While we were told that this was a red-
versus-blue election on November 7, it was also noted that Kerry�s GOTV strategy was working, based on increased votes/turnout. Senior analyst Charles Cook assumed that Bush made major inroads in black and Latino city voters but that assumption was not supported by the splits.
Then where did that Bush Urban Wave Originate?There was a minimal Republican GOTV campaign in big cities and, in general, a minimal presence in the form of advertising and special events. Thus the basis for converting any shift in sympathy to Bush was lacking. Only the National Exit Poll, the revised edition the day after the election, had the
special lens necessary to note surges of white big city voters who comprised the Bush victory margin. White voters had to account for the margin and the NEP analysts already knew that. There was no apparent general cause for a shift in loyalties and voting in big cities. The black, Latino, and Jewish voting blocks there had remained essentially unchanged since 2000.
For large urban areas, Latino votes doubled and went from 14% to 16% of the total vote compared to 2000. A small decline in absolute numbers, plus the increased Latino vote pushed the black urban share from 29% to 19% yet the national exit poll showed overall black turnout up 40%.
So the question remains: how do we account for the election winning Bush increases in big city vote share? We know that black, Latino, and Jewish voters in the big cities were strongly in favor of Kerry. The votes came from the only remaining big city voting block. There had to have been an unprecedented out pouring of white voters in large urban areas.
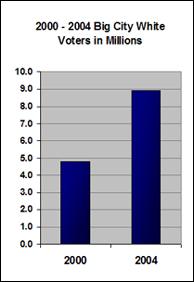
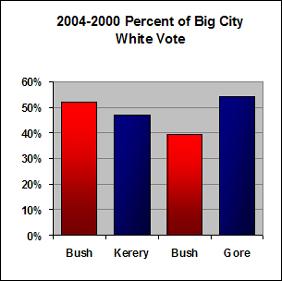
FIGURES 6 & 7. According to the NEP, white voters contributed less than 5 million votes to the big city segment in 2000 but almost 9 million in 2004. This is worthy of the term �surge.� They accounted almost exclusively for the increase from 2.3 million to 5.9 million big city votes for Bush from 2000 to 2004. Where did they come from? We may never know but they �won� the election.
The Nature of the Bush White Urban WaveThe white urban wave was shy, reluctant to show its true form and was perhaps a ghost in the machine. White turnout was supposed to go up as part of an overall increase. No one anticipated that it would materialize for Bush in the big cities in the way that it did. Nor does it help that these white voters were apparently �shy� about talking to pollsters.
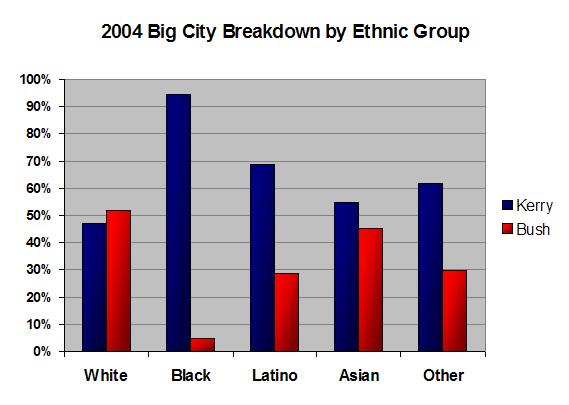
Figure 8. The Black and Latino vote in big cities didn�t shift much from 2004. Bush lost big again. But he did much better among big city whites than his 2000 performance.
Where then did the Bush swing in the urban wave come from? The simple answer is that it was
weighted into existence. The act of reconciling the exit polls to the official vote count
created it. The Bush urban voters came into existence because they had to� otherwise the official vote count would be wrong.
Weighting is a practice used by the US Census, political consultants, public health officials and others who conduct large scale survey research. If you collect data on a population, Latino voting patterns in the 2004 election for example, and your data is unrepresentative of a subset of that population, you can weight certain responses by a multiplier greater or less than one to make your poll consistent with the population measured. The problem though is when weighting is used to reconcile polling data with a �known fact� that may not be known at all.
The NEP assumes that the official vote total must be accurate and weights accordingly.The impossible election of 2004Generating the Bush urban wave was effortless. Only 10% of urban voters required a call. They were not required to attend rallies or watch television ads. In fact, many of them didn�t even need to vote. That was taken care of by the
weighting process conducted when the national exit poll was found to be inconsistent with the announced vote tallies. After all, how could the unintentionally released Election Day NEP be right in showing a 3% Kerry overall victory margin when the vote tabulators showed a 3% Bush win? Rural Americans didn�t produce that margin. Neither did the small towns or the suburbs. Even the improvement in the smaller cities wasn�t enough. The big cities, according to announced totals, delivered the vote for Bush.
Never mind the fact that exit polling reported that 95%, 66%, and 80% of black, Latino and Jewish voters supported Kerry. Never mind the fact that these voters represent over 50% of the United States urban population. Never mind the fact that whites in big cities are the most liberal group of whites in the nation. Finally, never mind that the new voter findings nationwide showed a 3 to 2 advantage for Kerry and that 40% of the voters in the big cities were new voters.
If there were ever a campaign that ignored on-the-ground efforts in big cities while espousing positions opposed by many in those cities, it was the 2004 Republican presidential campaign Bush was a divider not a uniter who pitted rural and suburban citizens against urban dwellers using wedge issues: the Iraq war; anti gay marriage amendments; religion forced into competition with science; the refusal to conduct stem cell research based on religious views; and opposition to a living wage for the poor. Then there was the Bush signal of solidarity to white conservatives by refusing to attend even one NAACP annual convention or Martin Luther King Day celebration. Bush was AWOL for the black voters other than the sanitized White House events.
The Bush campaign focused its efforts heavily, almost exclusively, on the rural areas and suburbs in order to counter the anticipated big city Democratic margins. But then the miracle occurred just when it was needed. White ghosts never seen before emerged from parking lots, alleys and perhaps even graveyards in big cities across the country to give George W. Bush a
stunning victory in the presidential election of 2004. It had to be this way, otherwise the vote count was wrong and who would tolerate such a notion, despite the clear signs on the ground and in the National Exit Poll? But the convenient and wide spread Red versus Blue story of election eve was maintained through inertia. For those with nagging questions, that story was replaced by the Urban Legend of 2004: Bush won the 2004 Presidential election in big cities.
The exit polls weighted a voting block into existence but the pollsters will have to work much harder to get anyone serious about the election to believe that those voters were found anywhere other than in weighting formulas generated to ratify the vote totals
At this point we have to believe two absurdities:
Bush lost a huge portion of his core constituency, rural America, which dropped from 23% to 16% of the overall vote total; yet he won the election. Rural citizens gave Bush 2.5 million fewer votes in 2004 than they contributed in 2000. In the small town segment, voting increased substantially and helped Kerry get to a break even point Yet Bush managed to be the only presidential candidate to win a high turnout election after losing his base; an election where overall turnout was up 16% overall but total presidential votes were down 17% in the rural base areas.
Bush won a huge increase in urban America, a place where Bush didn�t advertise significantly, where the GOTV effort was unnoticeable compared to Kerry�s, and where he was clearly an unpopular president; yet he won the election. For example, by 2005 50% of New Yorkers said that the federal government had �foreknowledge of 911� yet let it happen, he improved his vote count by over 20%. In the 32 big cities across America, he was able to piece together a remarkable increase in his vote from 2000 to carry him over the top and elect him President. We must believe this if we accept the final vote count as accurate. These cauldrons of hostility and suspicion about Bush paused on Election Day 2004, reflected, and suspended their animus at least when they voted.
It borders on the absurd to believe that Bush won reelection on the basis of this huge increase in big city votes and vote share from 2000 to 2004. We�re supposed to believe that he went from 2.3 million big city votes in 2000 to 5.4 million in 2004, a 153% increase. This artifact of the NEP�s weighting process is a dead letter that simply can�t be delivered. It strains the limits of credulity, although no one noticed or those who did weren�t talking. There was something very wrong with the NEP weighting process, specifically big city results. This is apparent from the analysis just completed. But there�s something much more troubling about the vote total.
And this is the problemThere have been heated debates on the internet regarding the outcome of the 2004 election. Much of the analysis focuses on the disparity between released and unreleased national exit polls. The mainstream media has not covered this controversy. Yet by August, 2006 more than half of Americans had expressed doubts that the 2004 results were
fair and square according to a Zogby Poll of 1018 registered voters nationwide.
(5) `
For this study, we chose the less controversial approach of using the final, revised exit poll with a focus on the stated purposes of the exit poll,
who were the voters and
where did they cast their ballots. Why not take the numbers the pollsters finalized the day after the election. Yet after careful scrutiny, we�ve shown that the NEP�s urban demographic data just don�t add up to even a remotely convincing explanation for a Bush victory. The data is clearly inconsistent, incompatible, and results in a conundrum rather than clarity about what happened on Nov. 2 2004. Doubt leads to disbelief.
And then there�s one more problem that casts doubt on the entire process. The NEP reports a 66% increase in voter turnout in the big cities, from 9 million votes in 2000 to 15 million in 2006. This provides foundation for the increases in Bush urban votes and percentages, even though there is no common sense or historical reason to believe such an increase in Bush votes ever took place, as we�ve demonstrated.
Now here�s the shocker. In addition to the analysis above, the 66% vote increase in the urban areas simply can�t be true on the basis of actual reports of big city vote totals. Why hasn�t this been widely discussed?
We have no idea but contradictory data exists which represents a huge problem.
While investigating the results of 2004, this inquiry asked about city specific results.
The response from a number of authorities was that these figures were difficult to find. Since counties reported totals; there was no one place that where a complete report of actual voting results for big city voting would show up.
That�s true but data is available for 12 of the 24 big cities for 2000 and 2004 and it shows nothing close to a 66% increase in turnout. These cities represent 61% of the total big city population as defined by the NEP; 23 million of the 38 million total inhabitants of big cities in 2004. Actual Big City Votes � 2000 and 2004
Official results reported by state and local boards of elections
These 12 cities represent 61% of the 2004 Big
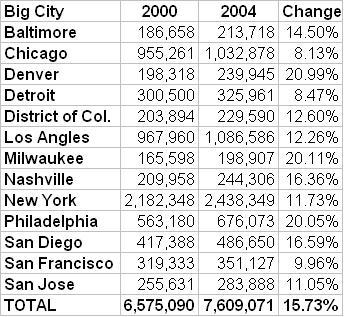
Chart 1. The cities listed are all �big cities� as defined by the NEP, major urban areas with populations over 500,000. �Turnout� percentages represent the increase in votes for president from 2000 to 2004. They are the actual vote totals from the cities listed. They were obtained from either the city board of elections or the state board of elections.
The total vote for these 12 big cities in 2000 was 6.57 million and 2004 7.61 million. That represents a 16% increase in turnout. (6) This accounts for 61% of the big city population. The remaining 39% of the big city group would have required over a 100% increase in turnout to have a big city average of 66% the NEP claims. We now have a double indictment of the 2004 NEP and a much larger question about the results of the election altogether. For over two years, the facts of the Bush victory have been on the table. On election night what was seemingly the best information on the election was ignored when the broadcasters announced a replay of election 2000, Red versus Blue, fundamentalists versus city voters. The story of the NEPs, the
Bush Urban Legend, was there to see but only Charles Cook and a few others pointed the stunning events purported by the exit polls and they failed to take an in depth look to discover the shocking appearance of all those white ghosts.
We are unaware of any major controversy regarding the
who voted where totals.
But now this. The explanation of the Bush victory margin through the 66% big city increase evaporates in view of this data. 16% is not even close to 66%. The 66% did not happen. All those white voters are phantoms, ghosts, artifacts born of necessity. There was no 66% increase in urban voting; but there was an increase consistent with the national average, about 16% based on actual voting data from the over 50% sample of big cities presented above.
Now, we�re left with the following mysteries.
How did the NEP get it so wrong on the urban vote? Was it simple expediency? They had an election to report. They had that 3% problem to handle, you know, the Kerry 51%-48% victory at the end of the day�s polling. There was very little time to handle it. The urban magic that Charles Cook extolled as a sign of Bush campaign genius was invented
. It came to be because it was the only way the poll could match the reported results.
Why was there no analysis of the urban vote based on actual reporting? First, you�d have to really want to understand it. There is no neat package and people with expertise tell you it�s pretty much a lost cause. Yes it is if you�re doing derivative research. If you look around in the nooks and crannies, it�s there, at least enough of it to make an obvious inference, in this case that the urban vote was no different than the rest of the nation in terms of turn out. A 66% increase is utter nonsense.
The net result is this. Take the 9.2 million NEP estimated big city votes in 2000 and apply a 17% increase in turnout for 2004 and you get 10.8 million votes. Subtracting the 10.7 million actual votes and from the NEP claimed 15.2 million for the same segment leaves a 4.5 million vote gap.
Or take a different approach. Use the 12 cities above, 60% of the big city population, and generate estimates for big city totals in 2000 and 2004. You get a total of 12.93 million in 2004. The 12.93 million actual votes in 2004 are 2.35 million short of the NEP�s estimated 15.2 million big city votes.
Given either scenario, there are millions of unaccounted for votes. We haven�t even looked at those counter intuitive results for cities 50 to 500 thousand. What could this mean? How can we be so sloppy with our vote totals and the election results for our big cities? Why are big city data and results apparently not worthy of investigation and comment?
Don�t look and you won�t have to tell. The only way a Bush victory makes sense, given his failure in rural America, is the addition of millions of votes to the urban centers, the impossible phenomenon.
Trying to find a Bush victory in 2004 leads you down a number of dead end streets. What happened to the rural vote? It was less as an over all percent of the national total and this segment provided less actual votes for Bush. What happened in the big cities? White votes were up from 5.0 to 9.0 million in one election; an 80% increase in white big city turnout.
One thing that we can no longer assume is that the election of 2004 produced the current occupant of the White House. In fact, the inability to show a logical path to the popular victory argues for a stance of informed scrutiny and intense skepticism.
If you believe 4.0 million new white big city voters showed up in 2004, you can believe the 2004 election results.
If you believe that Bush could conjure those new voters representing an 80% increase in white turnout over 2000 with just the slightest Get Out the Vote (GOTV) activity in big cities, you can believe the 2004 election results.
If you acknowledge that Bush
lost votes in his political base compared to 2004, the rural segment, yet soared to victory on the basis of substantial gains in the urban areas, then you can believe that he was the truly elected president in November 2004.
Those elected must be able demonstrate that they won a majority or plurality of the votes cast. There is no room left for that scenario in 2004. In the end, we are left with only the
Bush Urban Legend. ARTICLE END � REFERENCES AND APPENDICES FOLLOW************* Please feel free to reprint this and distribute it with attribution of authorship and a link to this article in �Scoop� Independent News. We encourage a wide distribution of this material in all media. Acknowledgments: Special thanks and appreciation are offered to Jonathan Simon, Jill Hayroot and others who reviewed this material and provided valuable comments. Also very special thanks to �Scoop� Independent News and Alastair Thompson for the ongoing leadership in their coverage of election and voting rights issues. A special debt is owed to the voting rights activists of the United States throughout its history. They give their time freely and risk hardship, injury, and sometimes death for our right to vote.******** References1. The 2004 National Exit Poll, Edison-Mitofsky, 2004. 2000 National Exit Day Polls, VNS, 2000.
2.
GOP Turns Out A Win By Charlie Cook � NationalJournal.com November 9, 2004
www.cookpolitical.com/column/2004/110904.php 3.
Latest vote, county by county 2004 2000 USAToday. 11/16/2004 -Updated 01:14 AM ET
www.usatoday.com/news/politicselections/vote2004/countymap.htm4.
President makes peace offer to political rivals, Bill Nichols and Peter Eisler, USA TODAY Posted 11/2/2004 9:24 PM Updated 11/5/2004 7:10 AM
www.usatoday.com/news/politicselections/vote2004/president.htm5. Zogby - Voters Question Outcome of �04 Election. Michael Collins. �Scoop� Independent News. Sept. 25, 2006
www.scoop.co.nz/stories/HL0609/S00346.htm 6. Elections for the following city/state election information resource.
California: Los �ngeles, San Diego, San Francisco, San Jose
Statement of Vote by Political Division in Counties, California 2000
tinyurl.com/2tgaw3 Statement of Vote by Political Division in Counties, California 2004
www.ss.ca.gov/elections/sov/2004_general/ssov/pres_general_ssov_all.xlsDepartment of the Registrar-Recorder/County Clerk, County of Los Angeles, 2000.
www.chicagoelections.com/wdlevel3.asp?elec_code=120[br />Chicago Board of Elections, Chicago Presidential Results 2004
www.chicagoelections.com/wdlevel3.asp?elec_code=90Davidson-Nashville, Tennessee
Tennessee Secretary of State 2004 Presidential Results
www.state.tn.us/sos/election/results/2004-11/index.htmTennessee Secretary of State 2004 Presidential Results
www.state.tn.us/sos/election/results/2000-11/index.htmDenver, Colorado
David Leip�s Presidential Atlas. Presidential Election Returns 2000 and 2004
www.uselectionatlas.org/BOTTOM/store_data.phpDetroit, Michigan
Department of State, Wayne County Presidential Results 2000
miboecfr.nicusa.com/cgi-bin/cfr/precinct_srch_res.cgi Department of State, Wayne County Presidential Results 2004
miboecfr.nicusa.com/cgi-bin/cfr/precinct_srch_res.cgiElection Precinct Result Search (Wayne County, Detroit City). Michigan Department of State.
miboecfr.nicusa.com/cgi-bin/cfr/precinct_srch.cgi Milwaukee, Wisconsin
City of Milwaukee Elections Commission Presidential Results 2000 - 2004
www.city.milwaukee.gov/ElectionResultsArchi15808.htmwww.city.milwaukee.gov/November720001754.htmNew York, New York
David Liep, Presidential Data, New York City
www.uselectionatlas.org/BOTTOM/store_data.phpPhiladelphia, Pennsylvania
Pennsylvania Department of State, Elections Information 2000 - 2004
www.electionreturns.state.pa.us/ElectionsInformation.aspx?FunctionID=15&ElectionID=2&OfficeID=1#PhiladelphiaWashington, DC Presidential Election Returns 2000-2004
Washington, DC Board of Election s 2000 & 2004 General Election Results
www.dcboee.org/information/elec_2000/general_elec.shtmwww.dcboee.org/information/elec_2004/pres_general_2004_results.shtm******** APPENDIX ONE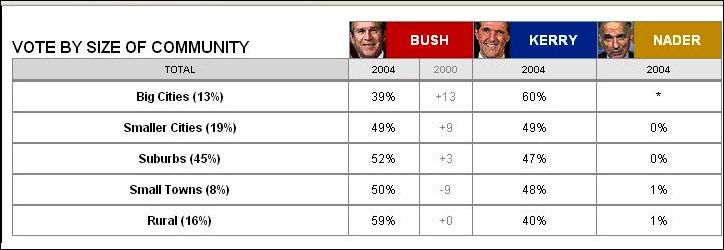 www.cnn.com/ELECTION/2004/pages/results/states/US/P/00/epolls.0.html
2004 Big Cities Smaller Cities Suburbs Small Towns Rural
Percent 13% 19% 45% 8% 16%
�NEP� Spread Sheet � our #�s
2004
Kerry 60% 49% 47% 48% 39%
Bush 39% 49% 52% 50% 59%
39% Rural is actually 39.4653% rounded = 40%
CNN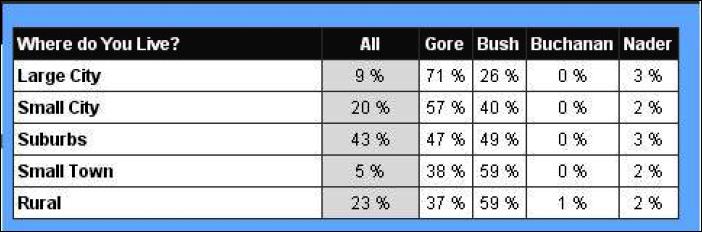 | www.cnn.com/ELECTION/2000/results/index.epolls.html 2000 Big Cities Smaller Cities Suburbs Small Towns Rural
Percent 9% 20% 43% 5% 23
NEP Spreadsheet � our #�s
2000
Gore 71% 57% 47% 38% 37%
Bush 26% 40% 49% 59% 59%
CNN
***ENDS***From: http://www.scoop.co.nz/stories/HL0706/S00165.htm