| Latest | Greatest | Lobby | Journals | Search | Options | Help | Login |
|
|
|
This topic is archived. |
| Home » Discuss » Topic Forums » Science |
|
| n2doc
|
Fri Feb-29-08 04:41 PM Original message |
| Friday Night Eye Candy: End of Feb edition (Usual Dialup warning) |
|
Friday Night Eye Candy
 Astronomers using NASA's Hubble Space Telescope have compiled a large catalog of gravitational lenses in the distant universe. The catalog contains 67 new gravitationally lensed galaxy images found around massive elliptical and lenticular-shaped galaxies. This sample demonstrates the rich diversity of strong gravitational lenses. If this sample is representative, there would be nearly half a million similar gravitational lenses over the whole sky. The lenses come from a recently completed, large set of observations as part of a huge project to survey a single 1.6-square-degree field of sky (nine times the area of the full Moon) with several space-based and Earth-based observatories. The COSMOS project, led by Nick Scoville at the California Institute of Technology, used observations from several observatories including the Hubble Space Telescope, the Spitzer Space Telescope, the XMM-Newton spacecraft, the Chandra X-ray Observatory, the Very Large Telescope (VLT), the Subaru Telescope, and the Canada-France-Hawaii Telescope. A team of European astronomers led by Jean-Paul Kneib (Laboratoire d'Astrophysique de Marseille) and Cecile Faure (Zentrum f�r Astronomie, University of Heidelberg) analyzed the results from Hubble's Advanced Camera for Surveys (ACS). From ACS high-resolution images, complemented by the extensive ground-based follow-up observations, astronomers have identified 67 strong gravitationally lensed galaxies. These lenses were found around very massive galaxies that are usually elliptical or lenticular in shape and have a deficiency of gas and dust. The strong lensing produced by massive galaxies are much more common than the usual giant "arc" gravitationally lensed galaxies that Hubble has previously observed; but they are generally more difficult to find as they extend over a smaller area and have a wide variety of shapes. Gravitational lensing occurs when light traveling toward us from a distant galaxy is magnified and distorted as it encounters a massive object between the galaxy and us. These gravitational lenses often allow astronomers to peer much farther back into the early universe than they would normally be able to do. The massive objects that create the lenses are usually huge clusters of massive galaxies. "We typically see the gravitational lens create a series of bright arcs or spots around a galaxy cluster. What we are observing here is a similar effect but on a much smaller scale � happening only around a single but very massive galaxy," said Kneib.  Cosmic Zoom Lens A massive cluster of yellowish galaxies is seemingly caught in a spider web of eerily distorted background galaxies in the left-hand image, taken with the Advanced Camera for Surveys (ACS) aboard NASA's Hubble Space Telescope. The gravity of the cluster's trillion stars acts as a cosmic "zoom lens," bending and magnifying the light of the galaxies located far behind it, a technique called gravitational lensing. The faraway galaxies appear in the Hubble image as arc-shaped objects around the cluster, named Abell 1689. The increased magnification allows astronomers to study remote galaxies in greater detail. Image Credit: NASA; ESA; L. Bradley (Johns Hopkins University); R. Bouwens (University of California, Santa Cruz); H. Ford (Johns Hopkins University); and G. Illingworth (University of California, Santa Cruz)  Mysterious Galaxy This image of the elliptical galaxy NGC 1132 and its surrounding region combines data from NASA's Chandra X-ray Observatory and the Hubble Space Telescope. The blue/purple in the image is the x-ray glow from hot, diffuse gas detected by Chandra. Hubble's data reveal a giant foreground elliptical galaxy, plus numerous dwarf galaxies in its neighborhood, and many much more distant galaxies in the background. Astronomers have dubbed NGC 1132 a "fossil group" because it contains an enormous amount of dark matter, comparable to the dark matter found in an entire group of galaxies. Also, the large amount of hot gas detected by Chandra is usually found for groups of galaxies, rather than a single galaxy. The origin of such fossil-group systems remains a puzzle. They may be the end products of the complete merging of groups of galaxies. Or, they may be very rare objects that formed in a region or period of time where the growth of moderate-sized galaxies was somehow suppressed, and only one large galaxy formed.  Illusion and Evolution What's happening to the galaxies of cluster Abell 2667? On the upper left, a galaxy appears to be breaking up into small pieces, while on the far right, another galaxy appears to be stretched like taffy in this image from the Hubble Telescope. To start, most of the yellowish objects are galactic members of a massive cluster of galaxies known as Abell 2667. The distortion of the galaxy on the upper left is real. As the galaxy plows through the intercluster medium, gas is stripped out and condenses to form bright new knots of stars. This detailed image of ram pressure stripping helps astronomers understand why so many galaxies today have so little gas. The distortion of the galaxy on the far right, however, is an illusion. This nearly normal galaxy is actually far behind the massive galaxy cluster. Light from this galaxy is gravitationally lensed by Abell 2667, appearing much like a distant person would appear through a wine glass. Each distorted galaxy gives important clues about how galaxies and clusters of galaxies evolve. 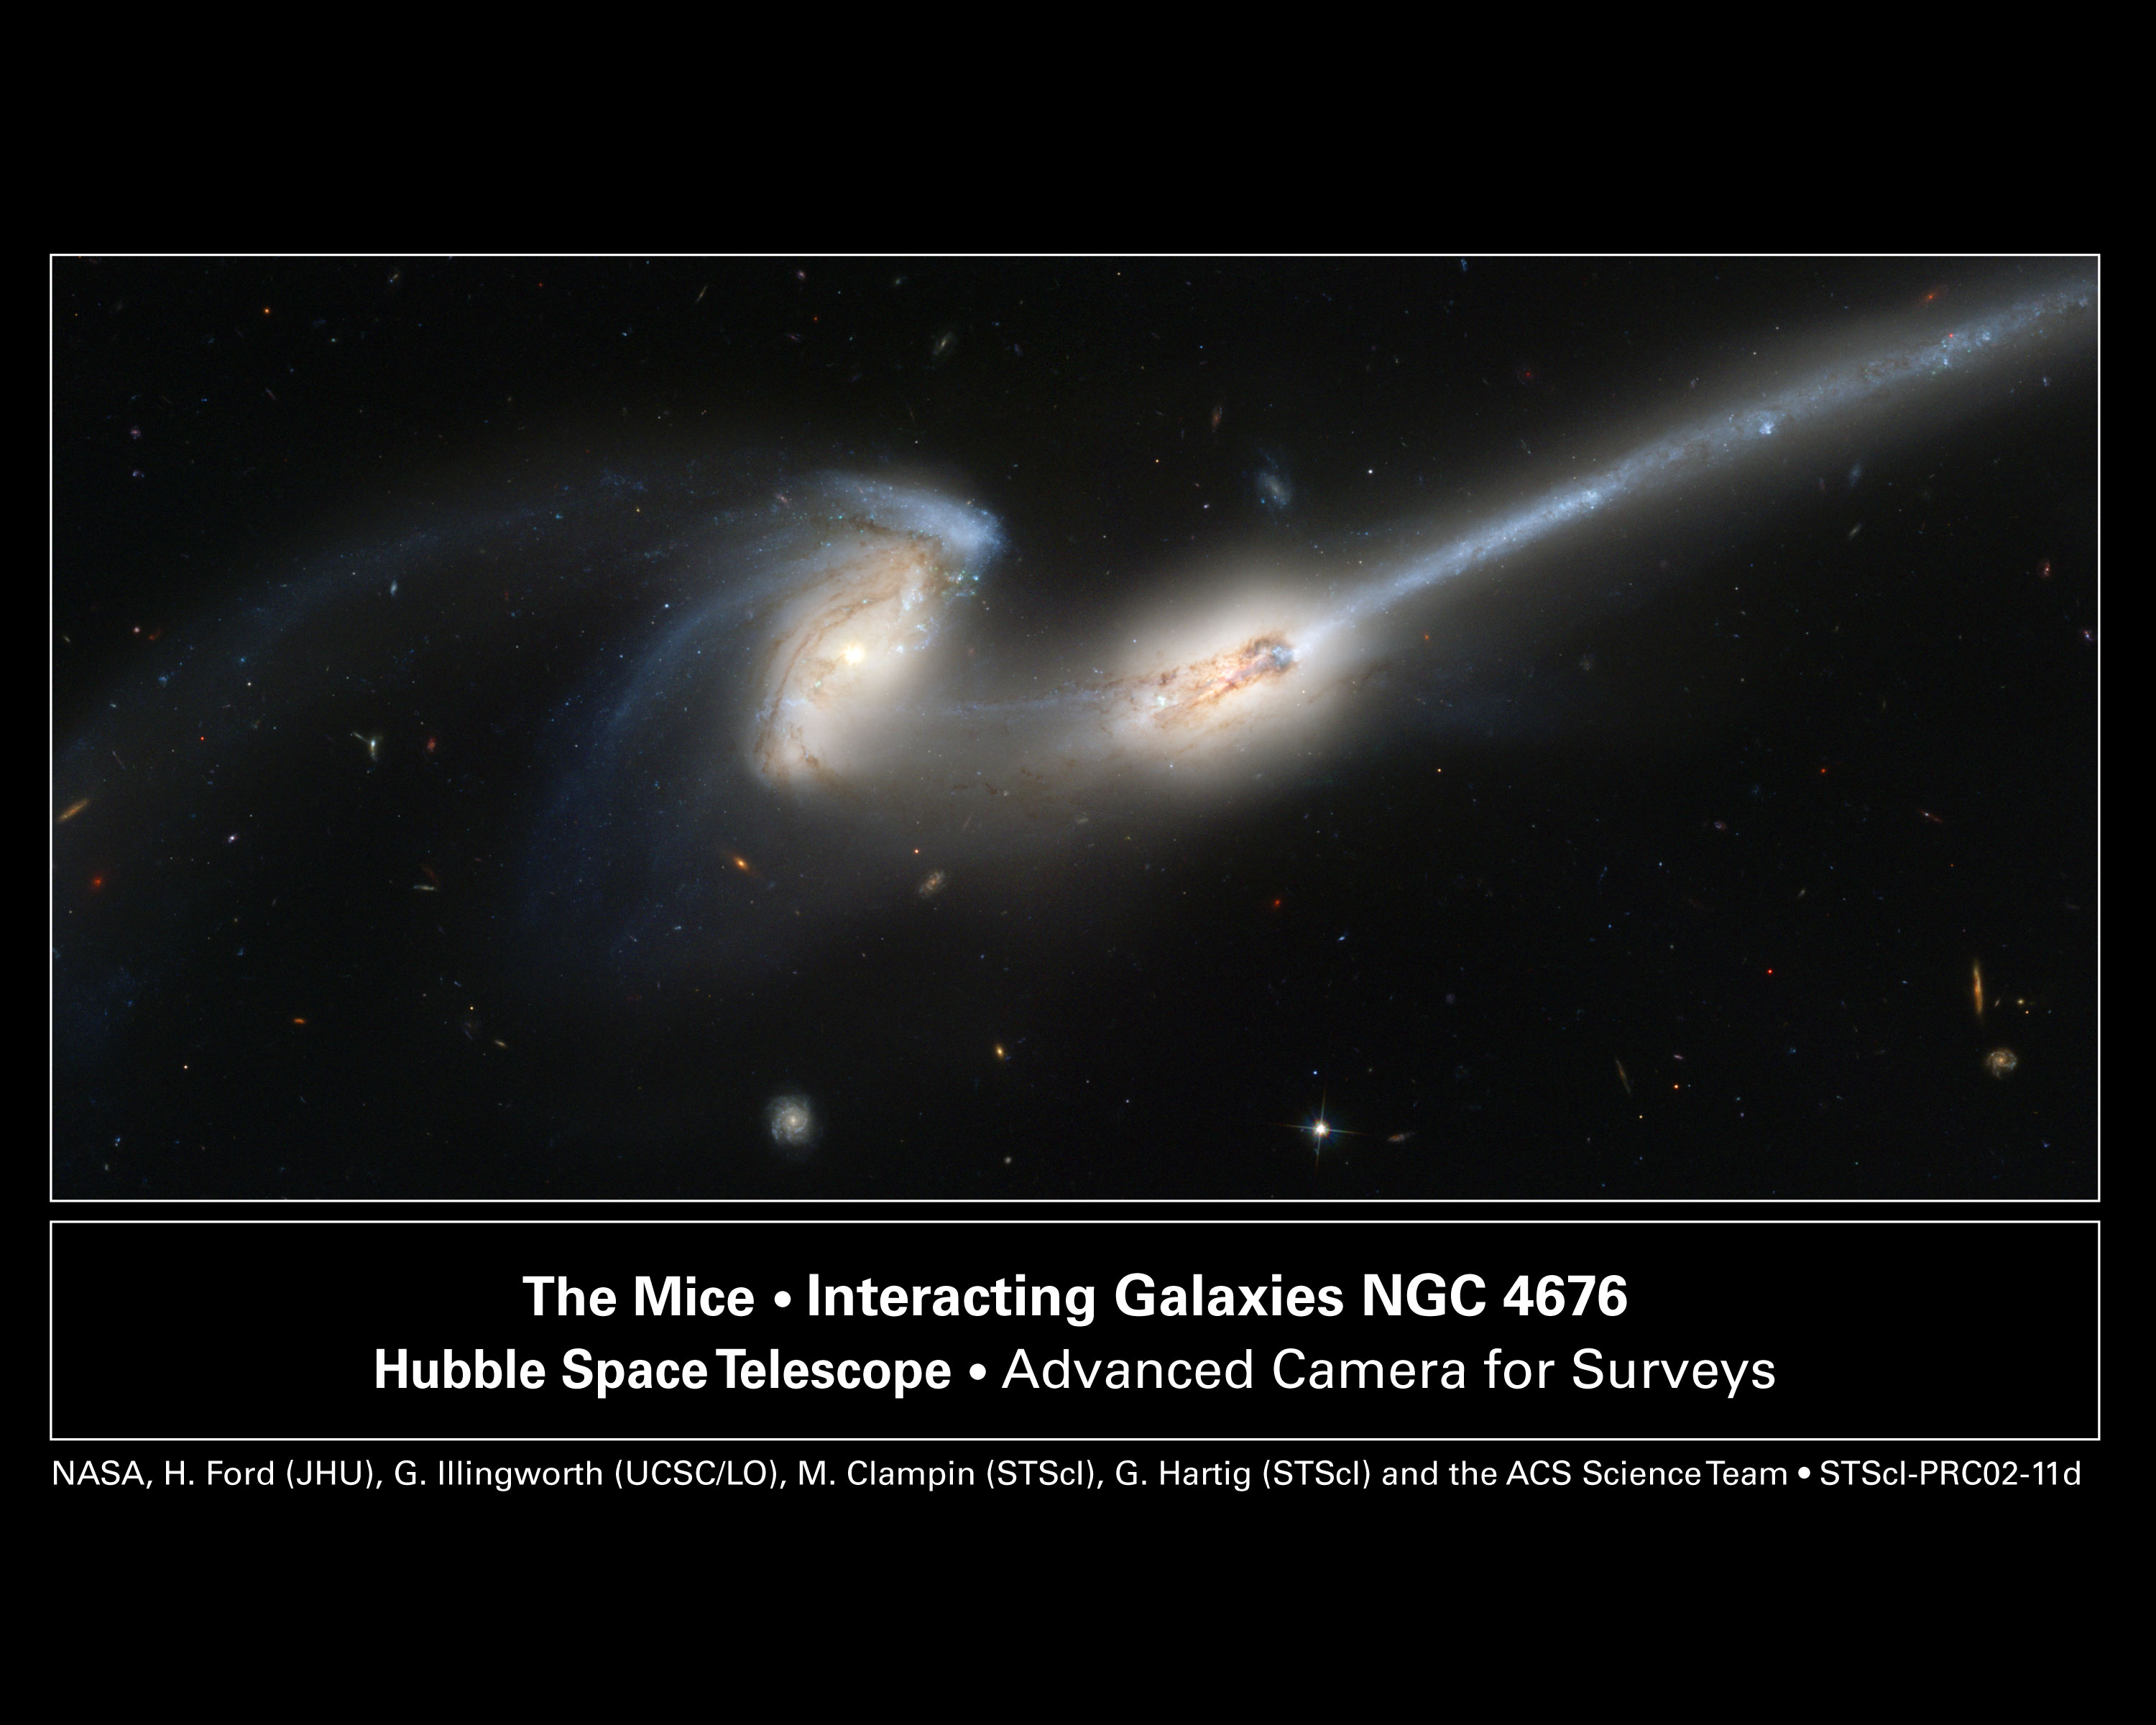 NGC 4676: When Mice Collide Credit: ACS Science & Engineering Team, Hubble Space Telescope, NASA Explanation: These two mighty galaxies are pulling each other apart. Known as " The Mice" because they have such long tails, each spiral galaxy has likely already passed through the other. They will probably collide again and again until they coalesce. The long tails are created by the relative difference between gravitational pulls on the near and far parts of each galaxy. Because the distances are so large, the cosmic interaction takes place in slow motion -- over hundreds of millions of years. NGC 4676 lies about 300 million light-years away toward the constellation of Bernice's Hair (Coma Berenices) and are likely members of the Coma Cluster of Galaxies. The above picture was taken with the Hubble Space Telescope's Advanced Camera for Surveys which is more sensitive and images a larger field than previous Hubble cameras. The camera's increased sensitivity has imaged, serendipitously, galaxies far in the distance scattered about the frame.  The Brightest of Stars Swirls of gas and dust reside in this ethereal-looking region of star formation seen by NASA's Hubble Space Telescope. This majestic view, located in the Large Magellanic Cloud (LMC), reveals a region where low-mass, infant stars and their much more massive stellar neighbors reside. A shroud of blue haze gently lingers amid the stars. Known as LH 95, this is just one of the hundreds of star-forming systems, called associations, located in the LMC some 160,000 light-years distant. Earlier ground-based observations of such systems had only allowed astronomers to study the bright blue giant stars present in these regions. With Hubble's resolution, the low-mass stars can now be analyzed, which will allow for a more accurate calculation of their ages and masses. Credit: NASA, ESA, and the Hubble Heritage Team (STScI/AURA)-ESA/Hubble Collaboration  Timeless Beauty Newborn stars peek out from beneath their natal blanket of dust in this dynamic image of the Rho Ophiuchi dark cloud from NASA's Spitzer Space Telescope. Called "Rho Oph" by astronomers, it's one of the closest star-forming regions to our own solar system. Located near the constellations Scorpius and Ophiuchus, the nebula is about 407 light years away from Earth. Rho Oph is made up of a large main cloud of molecular hydrogen, a key molecule allowing new stars to form from cold cosmic gas, with two long streamers trailing off in different directions. Recent studies reveal more than 300 young stellar objects within the large central cloud. Their median age is only 300,000 years, very young compared to some of the universe's oldest stars, which are more than 12 billion years old. The colors in this image reflect the relative temperatures and evolutionary states of the various stars. The youngest stars are surrounded by dusty disks of gas from which they, and their potential planetary systems, are forming. These young disk systems show up as red in this image. Some of these young stellar objects are surrounded by their own compact nebulae. More evolved stars, which have shed their natal material, are blue.  Dwarf Galaxies in the Coma Cluster In visible light images, more than a thousand galaxies are seen to lie within a volume about 20 million light-years across in the rich Coma Galaxy Cluster. But infrared images of the Coma Cluster are now being used to add thousands more to the Coma's galaxy count in the form of previously undiscovered dwarf galaxies. This composite combines infrared Spitzer Space Telescope image data (red and green) with visible light Sloan Sky Survey data (blue) for the central part of the cluster. Over 1 degree wide, the field is dominated by two giant elliptical galaxies in blue. Still, many of the small green smudges are identified as dwarf galaxies, roughly comparable to the Small Magellanic Cloud. Dwarf galaxies are thought to form first, providing building blocks for larger galaxies. The well-studied, friendly, Coma Cluster is 320 million light-years away.  Hot, Young Stars Westerlund 2, a young star cluster with an estimated age of about one or two million years, is the subject of study in this Chandra X-ray Observatory image. Until recently little was known about this cluster because it is heavily obscured by dust and gas. However, using infrared and X-ray observations, Westerlund 2 has become regarded as one of the most interesting star clusters in the Milky Way galaxy. It contains some of the hottest, brightest and most massive stars known. Image Credit: NASA/CXC/Univ. de Li�ge/Y. Naze et al   http://www.eso.org/public/outreach/press-rel/pr-2008/video/vid-05a-08.mpg Light echoes whisper the distance to a star Astronomers calibrate the distance scale of the Universe Taking advantage of the presence of light echoes, a team of astronomers have used an ESO telescope to measure, at the 1% precision level, the distance of a Cepheid - a class of variable stars that constitutes one of the first steps in the cosmic distance ladder. "Our measurements with ESO's New Technology Telescope at La Silla allow us to obtain the most accurate distance to a Cepheid," says Pierre Kervella, lead-author of the paper reporting the result. Cepheids <1> are pulsating stars that have been used as distance indicators since almost a hundred years. The new accurate measurement is important as, contrary to many others, it is purely geometrical and does not rely on hypotheses about the physics at play in the stars themselves. The team of astronomers studied RS Pup, a bright Cepheid star located towards the constellation of Puppis ('the Stern') and easily visible with binoculars. RS Pup varies in brightness by almost a factor of five every 41.4 days. It is 10 times more massive than the Sun, 200 times larger, and on average 15 000 times more luminous. RS Pup is the only Cepheid to be embedded in a large nebula <2>, which is made of very fine dust that reflects some of the light emitted by the star. Because the luminosity of the star changes in a very distinctive pattern, the presence of the nebula allows the astronomers to see light echoes and use them to measure the distance of the star. "The light that travelled from the star to a dust grain and then to the telescope arrives a bit later than the light that comes directly from the star to the telescope," explains Kervella. "As a consequence, if we measure the brightness of a particular, isolated dust blob in the nebula, we will obtain a brightness curve that has the same shape as the variation of the Cepheid, but shifted in time." This delay is called a 'light echo', by analogy with the more traditional echo, the reflection of sound by, for example, the bottom of a well. By monitoring the evolution of the brightness of the blobs in the nebula, the astronomers can derive their distance from the star: it is simply the measured delay in time, multiplied by the velocity of light (300 000 km/s). Knowing this distance and the apparent separation on the sky between the star and the blob, one can compute the distance of RS Pup. From the observations of the echoes on several nebular features, the distance of RS Pup was found to be 6500 light years, plus or minus 90 light years. "Knowing the distance to a Cepheid star with such an accuracy proves crucial to the calibration of the period-luminosity relation of this class of stars," says Kervella. "This relation is indeed at the basis of the distance determination of galaxies using Cepheids." RS Pup is thus distant by about a quarter of the distance between the Sun and the Centre of the Milky Way. RS Pup is located within the Galactic plane, in a very populated region of our Galaxy.   http://www.eso.org/public/outreach/press-rel/pr-2008/video/vid-04-08.mov New Light on Dark Energy Probing the cosmic Web of the Universe Astronomers have used ESO's Very Large Telescope to measure the distribution and motions of thousands of galaxies in the distant Universe. This opens fascinating perspectives to better understand what drives the acceleration of the cosmic expansion and sheds new light on the mysterious dark energy that is thought to permeate the Universe. "Explaining why the expansion of the Universe is currently accelerating is certainly the most fascinating question in modern cosmology," says Luigi Guzzo, lead author of a paper in this week's issue of Nature, in which the new results are presented. "We have been able to show that large surveys that measure the positions and velocities of distant galaxies provide us with a new powerful way to solve this mystery." Ten years ago, astronomers made the stunning discovery that the Universe is expanding at a faster pace today than it did in the past. "This implies that one of two very different possibilities must hold true," explains Enzo Branchini, member of the team. "Either the Universe is filled with a mysterious dark energy which produces a repulsive force that fights the gravitational brake from all the matter present in the Universe, or, our current theory of gravitation is not correct and needs to be modified, for example by adding extra dimensions to space." Current observations of the expansion rate of the Universe cannot distinguish between these two options, but the international team of 51 scientists from 24 institutions found a way that could help in tackling this problem. The technique is based on a well-known phenomenon, namely the fact that the apparent motion of distant galaxies results from two effects: the global expansion of the Universe that pushes the galaxies away from each other and the gravitational attraction of matter present in the galaxies' neighbourhood that pulls them together, creating the cosmic web of large-scale structures. "By measuring the apparent velocities of large samples of galaxies over the last thirty years, astronomers have been able to reconstruct a three-dimensional map of the distribution of galaxies over large volumes of the Universe. This map revealed large-scale structures such as clusters of galaxies and filamentary superclusters," says Olivier Le F�vre, member of the team. "But the measured velocities also contain information about the local motions of galaxies; these introduce small but significant distortions in the reconstructed maps of the Universe. We have shown that measuring this distortion at different epochs of the Universe's history is a way to test the nature of dark energy." Guzzo and his collaborators have been able to measure this effect by using the VIMOS spectrograph on Melipal, one of the four 8.2-m telescopes that is part of ESO's VLT. As part of the VIMOS-VLT Deep Survey (VVDS), of which Le F�vre is the Principal Investigator, spectra of several thousands of galaxies in a 4-square-degree field (or 20 times the size of the full Moon) at epochs corresponding to about half the current age of the Universe (about 7 billion years ago) were obtained and analysed. "This is the largest field ever covered homogeneously by means of spectroscopy to this depth," declares Le F�vre. "We have now collected more than 13,000 spectra in this field and the total volume sampled by the survey is more than 25 million cubic light-years." The astronomers compared their result with that of the 2dFGRS survey that probed the local Universe, i.e. measures the distortion at the present time. Within current uncertainties, the measurement of this effect provides an independent indication of the need for an unknown extra energy ingredient in the 'cosmic soup', supporting the simplest form of dark energy, the so-called cosmological constant, introduced originally by Albert Einstein. The large uncertainties do not yet exclude the other scenarios, though. "We have also shown that by extending our measurements over volumes about ten times larger than the VVDS, this technique should be able to tell us whether cosmic acceleration originates from a dark energy component of exotic origin or requires a modification of the laws of gravity," explains Guzzo. "VIMOS on the VLT would certainly be a wonderful tool to perform this future survey and help us answer this fundamental question. This strongly encourages scientists to proceed with even more ambitious surveys of the distant Universe," concludes Le F�vre.    The Growing-up of a Star VLT decodes the innermost surroundings of a star in the maturing Using ESO's Very Large Telescope Interferometer, astronomers have probed the inner parts of the disc of material surrounding a young stellar object, witnessing how it gains its mass before becoming an adult. The astronomers had a close look at the object known as MWC 147, lying about 2,600 light years away towards the constellation of Monoceros ('the Unicorn'). MWC 147 belongs to the family of Herbig Ae/Be objects. These have a few times the mass of our Sun and are still forming, increasing in mass by swallowing material present in a surrounding disc. MWC 147 is less than half a million years old. If one associated the middle-aged, 4.6 billion year old Sun with a person in his early forties, MWC 147 would be a 1-day-old baby <1>. The morphology of the inner environment of these young stars is however a matter of debate and knowledge of it is important to better understand how stars and their cort�ge of planets form. The astronomers Stefan Kraus, Thomas Preibisch, and Keiichi Ohnaka have used the four 8.2-m Unit Telescopes of ESO's Very Large Telescope to this purpose, combining the light from two or three telescopes with the MIDI and AMBER instruments. "With our VLTI/MIDI and VLTI/AMBER observations of MWC147, we combine, for the first time, near- and mid-infrared interferometric observations of a Herbig Ae/Be star, providing a measurement of the disc size over a wide wavelength range <2>," said Stefan Kraus, lead-author of the paper reporting the results. "Different wavelength regimes trace different temperatures, allowing us to probe the disc's geometry on the smaller scale, but also to constrain how the temperature changes with the distance from the star." The near-infrared observations probe hot material with temperatures of up to a few thousand degrees in the innermost disc regions, while the mid-infrared observations trace cooler dust further out in the disc. The observations show that the temperature changes with radius are much steeper than predicted by the currently favoured models, indicating that most of the near-infrared emission emerges from hot material located very close to the star, that is, within one or two times the Earth-Sun distance (1-2 AU). This also implies that dust cannot exist so close to the star, since the strong energy radiated by the star heats and ultimately destroys the dust grains. "We have performed detailed numerical simulations to understand these observations and reached the conclusion that we observe not only the outer dust disc, but also measure strong emission from a hot inner gaseous disc. This suggests that the disc is not a passive one, simply reprocessing the light from the star," explained Kraus. "Instead, the disc is active, and we see the material, which is just transported from the outer disc parts towards the forming star." The best-fit model is that of a disc extending out to 100 AU, with the star increasing in mass at a rate of seven millionths of a solar mass per year.  These images show evidence for the possible detection of a binary star system that was later destroyed in a supernova explosion. The right panel shows a Swift image, obtained with the optical/UV monitor, of the elliptical galaxy NGC 1404. At the center of the image is the supernova SN 2007on, originally discovered by the 0.25-m robotic telescope TAROT at La Silla in November, 2007. The left panel shows a Chandra X-ray Observatory image of the same field taken 4 years before the supernova was detected. The position of SN 2007on in the Chandra image is shown with a white circle, plotted with a radius that is much larger than the uncertainty in the supernova's position. The initial search for the progenitor of SN 2007on, reported in Nature, argued that the X-ray source lying inside the circle is the likely progenitor for the supernova. This claim was based on two main pieces of evidence: (1) the chance of a source being so close by coincidence is small, and (2) the X-ray source has similar properties to those expected for a particular type of progenitor predicted by theoretical work. However, this study included a relatively large uncertainty in the position of the supernova. Follow-up studies, yet to be published, used higher-quality optical images to better determine the supernova's position. This work showed there is a small, but significant difference in the measured positions of the supernova and the X-ray source, suggesting the source may not be the progenitor. This difference is visible in the left panel as the offset between the X-ray source and the center of the white circle. SN 2007on was a Type Ia supernova, an important class of object used to measure the expansion of the Universe. They are generally agreed to be produced by the explosion of a white dwarf star in a binary star system. The progenitor to a Type Ia supernova has never been detected, but promises to answer important questions about the exact configuration and trigger for these explosions. Is the explosion caused by a collision between two white dwarfs, or because a white dwarf became unstable by pulling too much material off a companion star? If the latter possibility is correct, fusion of material on the surface of the star should heat it and produce a strong source of X-rays before the explosion. Once the supernova explosion occurs, the white dwarf is expected to be completely destroyed and then would be undetectable in X-rays. Follow-up Chandra observations hint that the X-ray object has indeed disappeared, but further observations are needed to finally decide whether the source was the progenitor or not. Another possible explanation is that the nearby X-ray source is completely unrelated to the supernova.  Saturn  Rhea and Saturn Three views from the Cassini raw images website have been merged into a color view of Rhea floating in front of Saturn, captured on January 17, 2008. The images were captured through infrared, green, and ultraviolet filters, so the color is exaggerated with respect to what the human eye can detect. Credit: NASA / JPL / SSI / color composite by Emily Lakdawalla  Saturn's Moon Epimetheus from the Cassini Spacecraft Credit: Cassini Imaging Team, SSI, JPL, ESA, NASA Explanation: How did Epimetheus form? No one is yet sure. To help answer that question, this small moon has recently been imaged again in great detail by the robot spacecraft Cassini now orbiting Saturn. Epimetheus sometimes orbits Saturn in front of Janus, another small satellite, but sometimes behind. The above image, taken last December, shows a surface covered with craters indicating great age. Epimetheus spans about 115 kilometers across. Epimetheus does not have enough surface gravity to restructure itself into a sphere. The flattened face of Epimetheus shown above might have been created by a single large impact.  Saturn's Moons The moons are: top row: Dione, Mimas, Titan; middle row: Tethys, Rhea; bottom row: Enceladus, Hyperion, Iapetus. Credit: NASA / JPL / SSI  For an Earth observer on May 3, 2005, the Cassini spacecraft appeared to pass behind the rings, then Saturn, then the rings again (the red line). The discovered harmonic structure was found on both the way in and out, but only in locations where particles are densely packed together, such as the B ring and the innermost part of the A ring. The May 3 radio experiment and several others to follow in 2005 showed that the regular spacing of the harmonic structure vary from 100 to 250 meters (320 to 820 feet), depending on the location in the rings. To see an illustration of this occultation see PIA10232. The Cassini-Huygens mission is a cooperative project of NASA, the European Space Agency and the Italian Space Agency. The Jet Propulsion Laboratory, a division of the California Institute of Technology in Pasadena, manages the mission for NASA's Science Mission Directorate, Washington, D.C. The Cassini orbiter was designed, developed and assembled at JPL. The radio science team is based at JPL.  This synthetic aperture radar image was obtained by the Cassini spacecraft on its pass by Titan's south pole on Dec. 20, 2007. This image is centered near 76.5 south, 32.5 west and covers an area of 620 kilometers by 270 kilometers (385 miles by 170 miles). Abundant evidence for flowing liquids is seen in this image, from sinuous, wide river channels to shorter, more chaotic drainage patterns. The extremely dissected, rugged terrain in the southern portion of the image has been very eroded by flowing liquids, probably from a combination of methane rainstorms and sapping (subsurface methane rising to erode the surface). The broad valleys seen in the southern portion of the image are particularly intriguing, as they appear to be flat-floored, filled with smooth material, and in places have sharply defined, relatively straight sides. Valleys such as this can be formed by tectonic processes, such as rifting, or by erosional processes, caused by flowing liquid or ice. The Cassini-Huygens mission is a cooperative project of NASA, the European Space Agency and the Italian Space Agency. NASA's Jet Propulsion Laboratory, a division of the California Institute of Technology in Pasadena, manages the mission for NASA's Science Mission Directorate, Washington, D.C. The Cassini orbiter was designed, developed and assembled at JPL. The radar instrument was built by JPL and the Italian Space Agency, working with team members from the United States and several European countries. Jupiter  Detailed analysis of two continent-sized storms that erupted in Jupiter's atmosphere in March 2007 shows that Jupiter's internal heat plays a significant role in generating atmospheric disturbances. Understanding this outbreak could be the key to unlock the mysteries buried in the deep Jovian atmosphere, say astronomers. Understanding these phenomena is important for Earth's meteorology where storms are present everywhere and jet streams dominate the atmospheric circulation. Jupiter is a natural laboratory where atmospheric scientists study the nature and interplay of the intense jets and severe atmospheric phenomena. An international team coordinated by Agustin S�nchez-Lavega from the Universidad del Pa�s Vasco in Spain presents its findings about this event in the January 24 issue of the journal Nature. The team monitored the new eruption of cloud activity and its evolution with an unprecedented resolution using NASA's Hubble Space Telescope, the NASA Infrared Telescope Facility in Hawaii, and telescopes in the Canary Islands (Spain). A network of smaller telescopes around the world also supported these observations. According to the analysis, the bright plumes were storm systems triggered in Jupiter's deep water clouds that moved upward in the atmosphere vigorously and injected a fresh mixture of ammonia ice and water about 20 miles (30 kilometers) above the visible clouds. The storms moved in the peak of a jet stream in Jupiter's atmosphere at 375 miles per hour (600 kilometers per hour). Models of the disturbance indicate that the jet stream extends deep in the buried atmosphere of Jupiter, more than 60 miles (approximately100 kilometers) below the cloud tops where most sunlight is absorbed. Credit: NASA, ESA, IRTF, and A. S�nchez-Lavega and R. Hueso (Universidad del Pa�s Vasco, Spain ) Mars      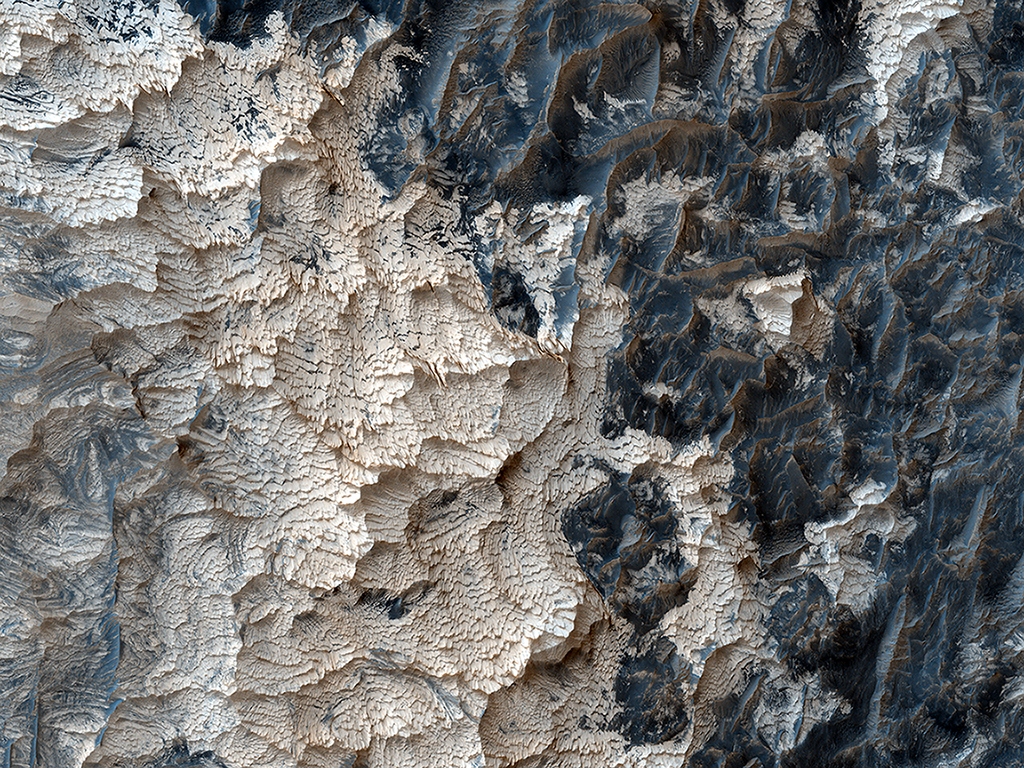   Mars Express took snapshots of Candor Chasma, a valley in the northern part of Valles Marineris, as it was in orbit above the region on 6 July 2006. The High Resolution Stereo Camera on the orbiter obtained the data in orbit number 3195, with a ground resolution of approximately 20 m/pixel. Candor Chasma lies at approximately 6� south and 290� east.  Clouds drift by Opportunity, sol 1,433 (February 4, 2008) Opportunity gazed skyward to capture this view of drifting clouds on sol 1,433 (February 4, 2008). The four images in this animation were taken about 30 seconds apart, and have all been flat-fielded to remove the effects of the dust that now covers Opportunity's camera windows. Credit: NASA / JPL / fredk  Creeping down Stroupe's Slide (3D) Use red-blue glasses to watch the animation in 3D. Over the course of nearly two months, Spirit has been inching its back wheels down from the top of Home Plate in order to increase the northward tilt of its solar panels, compensating for the northward motion of the Sun with the approaching winter. Credit: NASA / JPL / Emily Lakdawalla Meanwhile, over in Gusev crater, there's been a hiatus in official mission updates. But the images show that Spirit's been inching down the slope from Home Plate in order to increase the northward tilt of its solar panels, trying to eke out enough energy to survive the winter. Here's a 3D animation, made from rear hazcam images; it's the rear wheels that are slowly rolling down the slope, while the front wheels remain on top of Home Plate. (You'll need red-blue glasses to see the 3D effect.) It seems the rear hazcams, nestled as they are underneath the rover's body and solar panels, are relatively dust-free. As of sol 1,459 (February 9, 2008), Spirit's tilt was approximately 30 degrees. Venus 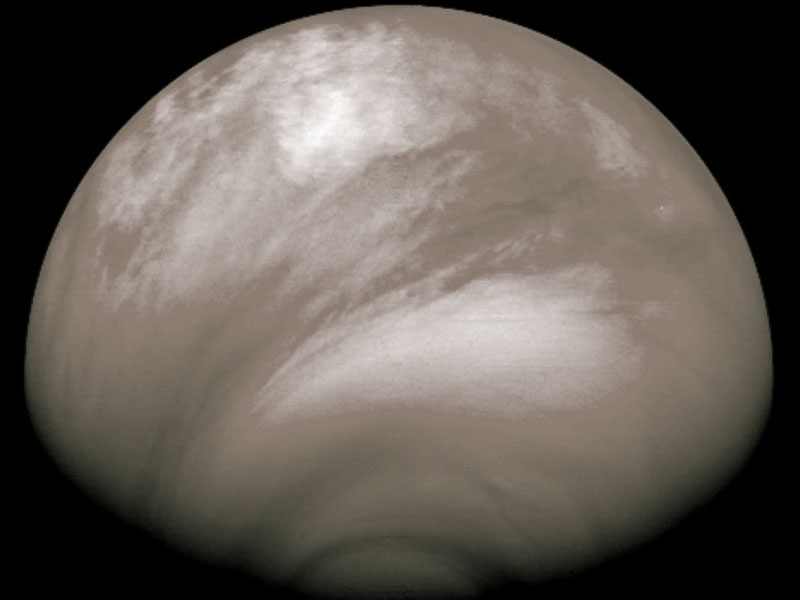 Mysterious Acid Haze on Venus Credit: ESA/MPS, Katlenburg-Lindau, Germany Explanation: Why did an acidic haze spread across Venus? The unusual clouds were discovered last July by ESA's robotic Venus Express spacecraft currently orbiting Venus. The bright and smooth haze was found by Venus Express to be rich in sulfuric acid, created when an unknown process lifted water vapor and sulphur dioxide from lower levels into Venus' upper atmosphere. There, sunlight broke these molecules apart and some of them recombined into the volatile sulfuric acid. Over the course of just a few days last July, the smooth acidic clouds spread from the South Pole of Venus across half the planet. The above false-color picture of Venus was taken last July 23rd in ultraviolet light, and shows the unusual haze as relatively smooth regions across the image bottom. The cause of the dark streaks in the clouds is also not yet understood and is being researched. Mercury  Dark-halo craters near Mercury's south pole MESSENGER took this photo of Mercury as it departed from its first flyby at 19:59:41 on January 14, 2008 UTC. The image contains two craters with dark halos, which may indicate that Mercury's surface is layered, with different compositions at different depths. Alternatively, the dark halos could represent deposits of material that was melted during the impact; such materials are often darker in color than unmelted rock.Credit: NASA / JHUAPL / CIW  The color image was generated by combining three separate images taken through WAC filters sensitive to light in different wavelengths; filters that transmit light with wavelengths of 1000, 700, and 430 nanometers (infrared, far red, and violet, respectively) were placed in the red, green, and blue channels, respectively, to create this image. The human eye is sensitive across only the wavelength range 400 to 700 nanometers. Creating a false-color image in this way accentuates color differences on Mercury's surface that cannot be seen in the single-filter, black-and-white images released last week. http://messenger.jhuapl.edu/news_room/images/solomon/Solomon01_approach.mov http://messenger.jhuapl.edu/news_room/images/prockter/Prockter08Departure.mov Earth  The Air Up There This colorful view of airglow layers at Earth's horizon was photographed by the space shuttle Atlantis crew on Feb. 8, 2008, the second day of the STS-122 mission.  Isle Royale National Park Isle Royale National Park includes a group of islands and the surrounding waters of Lake Superior. Access to the park is via seaplane or ferry service, and from November through mid-April each year, the park is closed to visitors. This isolation has allowed the park to remain relatively pristine, and it was designated a U.S. Biosphere Reserve in 1980. The most striking aspects of this image are the deep blue waters of the lake around the main island and the long parallel ridges formed from lava flows some 1.2 billion years ago running the 45-mile length of Isle Royale. They have eroded and weathered in the eons since, and most recently, they were scoured by an ice sheet during the last ice age. A more subtle feature is what remains unseen: the entire park is roadless. Visitors to the park either use the network of hiking trails or travel around in small boats. The island has populations of moose and wolves and the island's isolation allows field biologists to track predator-prey relationships with fewer potential sources of confusion and to observe the impact of sudden change on the relationship. As recently as 1900, there were no moose on the island at all. On the other hand, lynx, caribou and coyotes, all now absent, were observed by visitors. |
| Printer Friendly | Permalink | | Top |
| Home » Discuss » Topic Forums » Science |
|
Powered by DCForum+ Version 1.1 Copyright 1997-2002 DCScripts.com
Software has been extensively modified by the DU administrators
Important Notices: By participating on this discussion board, visitors agree to abide by the rules outlined on our Rules page. Messages posted on the Democratic Underground Discussion Forums are the opinions of the individuals who post them, and do not necessarily represent the opinions of Democratic Underground, LLC.
Home | Discussion Forums | Journals | Store | Donate
About DU | Contact Us | Privacy Policy
Got a message for Democratic Underground? Click here to send us a message.
© 2001 - 2011 Democratic Underground, LLC