Democratic Underground Latest Greatest Lobby Journals Search Options Help Login
Google

BradBlog: Minority Undervote Rate Plummets After New Mexico Switches to All Paper Ballots...

Printer-friendly format Printer-friendly format
Printer-friendly format Email this thread to a friend
Printer-friendly format Bookmark this thread
This topic is archived.
Home » Discuss » Topic Forums » Election Reform Donate to DU
 
Wilms Donating Member (1000+ posts) Send PM | Profile | Ignore Tue Feb-27-07 01:39 AM
Original message
BradBlog: Minority Undervote Rate Plummets After New Mexico Switches to All Paper Ballots...

REPORT: Undervote Rate Plummets 85% in New Mexico's Native American Precincts after Statewide Switch from Touch-Screen Voting to Paper Ballots

Brad Friedman

2/26/2007

Comparison of Voting Data from 2004 to 2006 Shows Hispanic Undervote Plunged 69% as the 'Civil Rights' Case for DREs Continues to Fall Apart

ALSO: New Concerns Emerge About Racial Profiling vis a vis Touch-Screen Voting Systems...

snip

Details now out from New Mexico reveal that undervote rates dropped precipitously in both Native American and Hispanic areas after the state moved from DRE's in 2004 to paper-based optical-scan systems in 2006. In Native American areas, undervote rates plummeted some 85%. In Hispanic communities, the rate dropped by 69% according to the precinct data reviewed by the Election Defense Alliance, VotersUnite.org and VoteTrustUSA.org.

snip

http://www.bradblog.com/?p=4193


GD Discussion (bump for the morning crowd):

http://www.democraticunderground.com/discuss/duboard.php?az=show_mesg&forum=389&topic_id=294166&mesg_id=294166

Printer Friendly | Permalink |  | Top
Fridays Child Donating Member (1000+ posts) Send PM | Profile | Ignore Tue Feb-27-07 01:59 AM
Response to Original message
1. Quelle surprise.
Paperless voting seems to be especially hard on minority votes.
Printer Friendly | Permalink |  | Top
 
pennylane100 Donating Member (1000+ posts) Send PM | Profile | Ignore Tue Feb-27-07 02:22 AM
Response to Reply #1
2. I cannot think how it can be harder for one person than another to vote by mail
regardless of their social or ethnic group.

It would seem to me that the two most obvious variables are that minorities do not vote in mailed elections (which seems hard to believe) or that their votes are somehow missed, which would also seem really strange, if we had not had so many voting irregularities over the last few years.
Printer Friendly | Permalink |  | Top
 
EST Donating Member (1000+ posts) Send PM | Profile | Ignore Tue Feb-27-07 03:14 AM
Response to Reply #2
4. I agree with you, however, I have been a bit suspicious
of vote by mail-in spite of the generally enthusiastic acceptance by participants in the areas which use that process to a large degree.

It strikes me that from the time you drop your ballot into the mail until the totals are posted after counting and tallying at the far end, the system is shrouded. As is now obvious to anyone willing to acquaint themselves with the abysmal record of the last few elections, devious partisan hacks will always find a way to produce their own results, given an opportunity. Vote by mail seems to provide an ideal cover for publiclown interference with minority voting, particularly since minority votes are generally overwhelmingly democratic.

This report is a marvel of evidentiary simplicity and points to the need for objective, thorough observation at all times during the voting process.
Printer Friendly | Permalink |  | Top
 
aquart Donating Member (1000+ posts) Send PM | Profile | Ignore Tue Feb-27-07 03:02 AM
Response to Original message
3. I'm shocked. Goodness me.
Printer Friendly | Permalink |  | Top
 
kster Donating Member (1000+ posts) Send PM | Profile | Ignore Tue Feb-27-07 03:22 AM
Response to Original message
5. Optical scanned ballot are a life saver, Well,
Lets say you have a Native American and a Hispanic stranded in the middle of the ocean, a Helicopter flies over head, but the Helicopter has to get the hell out of there (storms approaching), the Helicopter has two life rafts that are 100% filled with air, the Helicopter team notices that one of the guys is a Native American, so the team proceeds to let 15% of the air out of the life raft, they then throw it down to the Native American.

Atleast he has a life raft, I guess.

They then fly to the other guy and realize that he is an Hispanic, from the second life raft, they let out 31% of the air, and throw it down to the Hispanic.

You know what I mean, in life saving and/or vote counting the numbers should not be that different, no matter what.

Hand Count the Paper Ballots, CARRY ON....


Printer Friendly | Permalink |  | Top
 
livvy Donating Member (1000+ posts) Send PM | Profile | Ignore Tue Feb-27-07 06:17 AM
Response to Original message
6. Get rid of the damn things, once and for all.
The ways to use the damn things to alter the voice of the people seems to be unlimited. This hit me from the article. It's not something that I had thought about before, but it's so simple and obvious, it should have.
That chart in the report is an excellent graphic. If the data that supports it is accurate, it is a very stark and compelling piece of evidence to invalidate the use of DRE's, evidence that your average 4th grader, should be able to interpret.

The analysts of the data in New Mexico have also brought to our attention yet another new, disturbing dimension to touch-screen voting systems: they allow for simple racial profiling in elections. Whenever a voter must tell the system, at the beginning of the voting process, the language in which they want to vote, they are also opening the door for a malicious programmer to alter the behavior of the voting system based on that particular language choice.

Given the ease by which virtually all electronic voting machines have now been shown to be hackable, the idea that a system could be programmed to behave a certain way only for minority voters is an alarming one. We'd suggest it's even further evidence making the case that it's time to bring America's reckless experimentation with dangerous touch-screen voting to a complete and final end.


Astounding and very disturbing information.
Printer Friendly | Permalink |  | Top
 
Melissa G Donating Member (1000+ posts) Send PM | Profile | Ignore Tue Feb-27-07 09:14 AM
Response to Reply #6
7.  excellent point, livvy. good excerpt. n/t
Printer Friendly | Permalink |  | Top
 
Time for change Donating Member (1000+ posts) Send PM | Profile | Ignore Tue Feb-27-07 10:18 AM
Response to Original message
8. Though this finding is not unexpected, I believe it should be considered hugely important
There is very good evidence that John Kerry won New Mexico in 2004 if not for the ridiculously high undervote rates on those DRE machines. This study once again confirms that, and it should be seen as solid evidence for potentially convincing our legislators.
Printer Friendly | Permalink |  | Top
 
L. Coyote Donating Member (1000+ posts) Send PM | Profile | Ignore Tue Feb-27-07 12:34 PM
Response to Original message
9. The Sources: VotersUnite.org Press Release
Edited on Tue Feb-27-07 12:36 PM by L. Coyote
http://votetrustusa.org/index.php?option=com_content&task=view&id=2290&Itemid=113

"The report shows that in predominantly Native American and predominantly Hispanic precincts, undervote rates were abnormally high (7.61% and 6.33% respectively) in the 2004 presidential race, when the votes were cast on DREs. In 2006, after the state changed to all optically scanned paper ballots, the undervote rates for Governor in those same precincts plummeted by 85% in Native American areas and by 69% in predominantly Hispanic precincts....."

MORE.

===========

New Mexico led the nation in “percentage of undervotes” reported in 2004. NM had 2.417% undervotes in 2004, and 2.762% in 2000. This was a known problem, and in both the NM 2000 and NM 2004 elections, it may have changed the NM outcomes.

Not all NM counties had the same undervote rate, and the difference is dramatically machine biased (chart below), with one exception. The only ES&S County reporting over 1.0%, small, heavily Democratic Del Baca County reported the highest rate in the state. Del Baca reported overwhelming Bush voting and over 8% undervoting.

FROM: 2004 New Mexico Presidential Election Results


# Pres. # Non-Vote % Non-Vote % Kerry % Bush % 3rd
756,363 18,731 2.42 47.86 48.64 1.09


2.42% of NM ballots are undervotes, triple Bush’s 6,000 vote margin. If New Mexico had Nevada’s undervote rate and 3/4 of the remaining undervotes are uncounted Kerry votes, Kerry wins New Mexico.

Kerry Bush
370,946 376,975
9,366 3,122
380,312 380,097


This then leads into “WHERE” votes went uncounted. Taos had way, way over 3/4 Kerry support. The Native Americans vote like the inner-city precincts, is about 90% Dems. A clear understanding of “Which candidate’s votes are uncounted” is important in terms of accomplishing “stealing” votes. Precinct level under voting rate can determines how much the uncounted presidential votes would have changed outcome. County level statistics average out localized under voting rates.

Undervotes.

I wrote, “If New Mexico had Nevada’s undervote rate and 3/4 of the remaining undervotes are uncounted Kerry votes, Kerry wins New Mexico.” This comparison can be made using, instead, the NM counties with normal undervotes. All the counties below the 1% line on the graph below average, at 0.45%, even lower than Nevada’s county average. Such a comparison also emphasizes the unfair NM machine bias (or whatever this was). I just studied this further, and here is a new statistical summary of the vote counting disparities in NM, comparing the two very obvious NM groups:

In the low undervote group of 12 counties, Bush has 19% higher support, and all 12 of the normal undervote counties reported favoring Bush.

In 12 NM Bush counties (15% of votes) non-voting is below 0.78%, averaging 0.45%.
In 21 NM counties (85% of votes) non-voting ranges from 2.03% to 8.4%, at 2.76% of voters.

The Kerry support correlation to undervoting is equally explicit in Cuyahoga County. The % Kerry to % non-vote correlation for 33 NM counties is 0.454, the Cuyahoga County correlation for 1432 precincts is 0.423. Bush’s vote has a -0.562 correlation non-vote percentages for NM counties, -0.500% in Cuyahoga precincts. The big difference between Ohio and NM seems to be which minority is being robbed of votes.

If the Ohio e-vote counties’ percentage of non-votes is applied to Cuyahoga County precincts, and if the excess non-votes over that percentage are counted according to the reported precinct voting, these voters would add 4,833 Kerry and 1,284 Bush votes. The 11.0% of Cuyahoga precincts with over 3.6% non-votes have 27.7% of the non-votes and a mean of 10.25% Bush voting. Kerry’s support county wide is 65.66% while 79.01% of excess non-votes are undertallied Kerry supporters. The Bush vote was reported to be 32.00% while only 20.99% of the undertallied are Bush supporters. In NM, this proportion, 79% Kerry to 21% Bush, would give Kerry the victory. Simply put, “While Cuyahoga reported 2/3 Kerry voters, 4/5 of excess non-votes are probable Kerry supporters.”

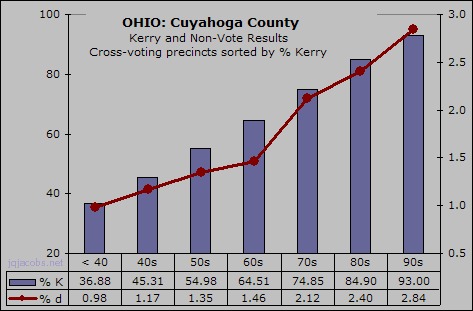
Why is undervoting focused in Kerry areas? In Cuyahoga, part of the non-vote is punch card cross-voting. In NM, punch cards cannot be blamed and the correlation to voting machines is far beyond credibly coincidence. It is very difficult to not conclude that Kerry votes are the target of the irregularity. Note the smooth pattern in Cuyahoga non-vote rates when precincts are sorted by Kerry support (after vote theft results, of course).


Source: http://jqjacobs.net/politics/
Printer Friendly | Permalink |  | Top
 
L. Coyote Donating Member (1000+ posts) Send PM | Profile | Ignore Tue Feb-27-07 12:46 PM
Response to Original message
10.  Was "honesty factor" imposed on elections thanks to the DRE machines?
Let's move past all the hype and leave the spin doctors out of this for a moment, by asking an easy to answer question.

"Are the Dem gains in 2006 the result of the 'Honesty Factor?'"

While I've seen the term "landslide denied" promoted, I have not seen anything convincing in that regard. And, that idea would be easy to test by comparing how vote results changed in precincts with new equipment.

I suspect the Ohio change is due to the "honesty factor" imposed on elections thanks to the DRE machines replacing punch card voting. REvolutionary thinking, I know!

I await comparative study results from the authors of the "landslide denied" theory, but, the obvious is the obvious at least in Ohio, and I don't think they are willing to debunk their own premise!
Printer Friendly | Permalink |  | Top
 
DU AdBot (1000+ posts) Click to send private message to this author Click to view 
this author's profile Click to add 
this author to your buddy list Click to add 
this author to your Ignore list Fri May 03rd 2024, 08:11 AM
Response to Original message
Advertisements [?]
 Top

Home » Discuss » Topic Forums » Election Reform Donate to DU

Powered by DCForum+ Version 1.1 Copyright 1997-2002 DCScripts.com
Software has been extensively modified by the DU administrators


Important Notices: By participating on this discussion board, visitors agree to abide by the rules outlined on our Rules page. Messages posted on the Democratic Underground Discussion Forums are the opinions of the individuals who post them, and do not necessarily represent the opinions of Democratic Underground, LLC.

Home  |  Discussion Forums  |  Journals |  Store  |  Donate

About DU  |  Contact Us  |  Privacy Policy

Got a message for Democratic Underground? Click here to send us a message.

© 2001 - 2011 Democratic Underground, LLC