Democratic Underground Latest Greatest Lobby Journals Search Options Help Login
Google

Renewables to Grow Fastest in Next 25 Years – But Carbon Keeps Soaring

Printer-friendly format Printer-friendly format
Printer-friendly format Email this thread to a friend
Printer-friendly format Bookmark this thread
Home » Discuss » Topic Forums » Environment/Energy Donate to DU
 
NickB79 Donating Member (1000+ posts) Send PM | Profile | Ignore Tue Sep-20-11 04:31 PM
Original message
Renewables to Grow Fastest in Next 25 Years – But Carbon Keeps Soaring
http://www.environmentalleader.com/2011/09/20/renewables-to-grow-fastest-in-next-25-years-but-carbon-keeps-soaring/

"Renewable power will be the fastest-growing energy source over the next 25 years, but fossil fuels will remain the dominant energy source as carbon emissions rise by 43 percent, according to the reference case of the Energy Information Administration’s annual global projections.

The International Energy Outlook 2011 (IEO2011) reference case, which does not incorporate prospective legislation or policies that might affect energy markets, projects that renewable energy consumption will rise 2.8 percent per year and the renewable share of total energy use will increase from 10 percent in 2008 to 15 percent in 2035. Fossil fuels, however, will still account for 78 percent of world energy use in 2035 under this scenario.

The paper says that, in the reference case, energy-related carbon dioxide emissions will rise from 30.2 billion metric tons in 2008 to 43.2 billion metric tons in 2035—an increase of 43 percent. Much of the increase in carbon dioxide emissions is projected for developing nations, especially in Asia."


The crux of the matter appears to be that developing nations are demanding so much extra energy (to emulate US/European lifestyles) that even the meteoric rise of renewables isn't enough to satisfy demand over the next 20 years. All the solar panels and wind turbines we're installing appear to be slowing the build-out of fossil fuel plants, but not reversing the trend and allowing us to start closing those thermal plants.

Let's all hope that the EIA is wrong (which is quite possible given their track record), because if not, we can kiss most existing ecosystems goodbye.
Refresh | +3 Recommendations Printer Friendly | Permalink | Reply | Top
Cool Logic Donating Member (1000+ posts) Send PM | Profile | Ignore Tue Sep-20-11 05:46 PM
Response to Original message
1. Help is one the way...and it's name is technological advancement.
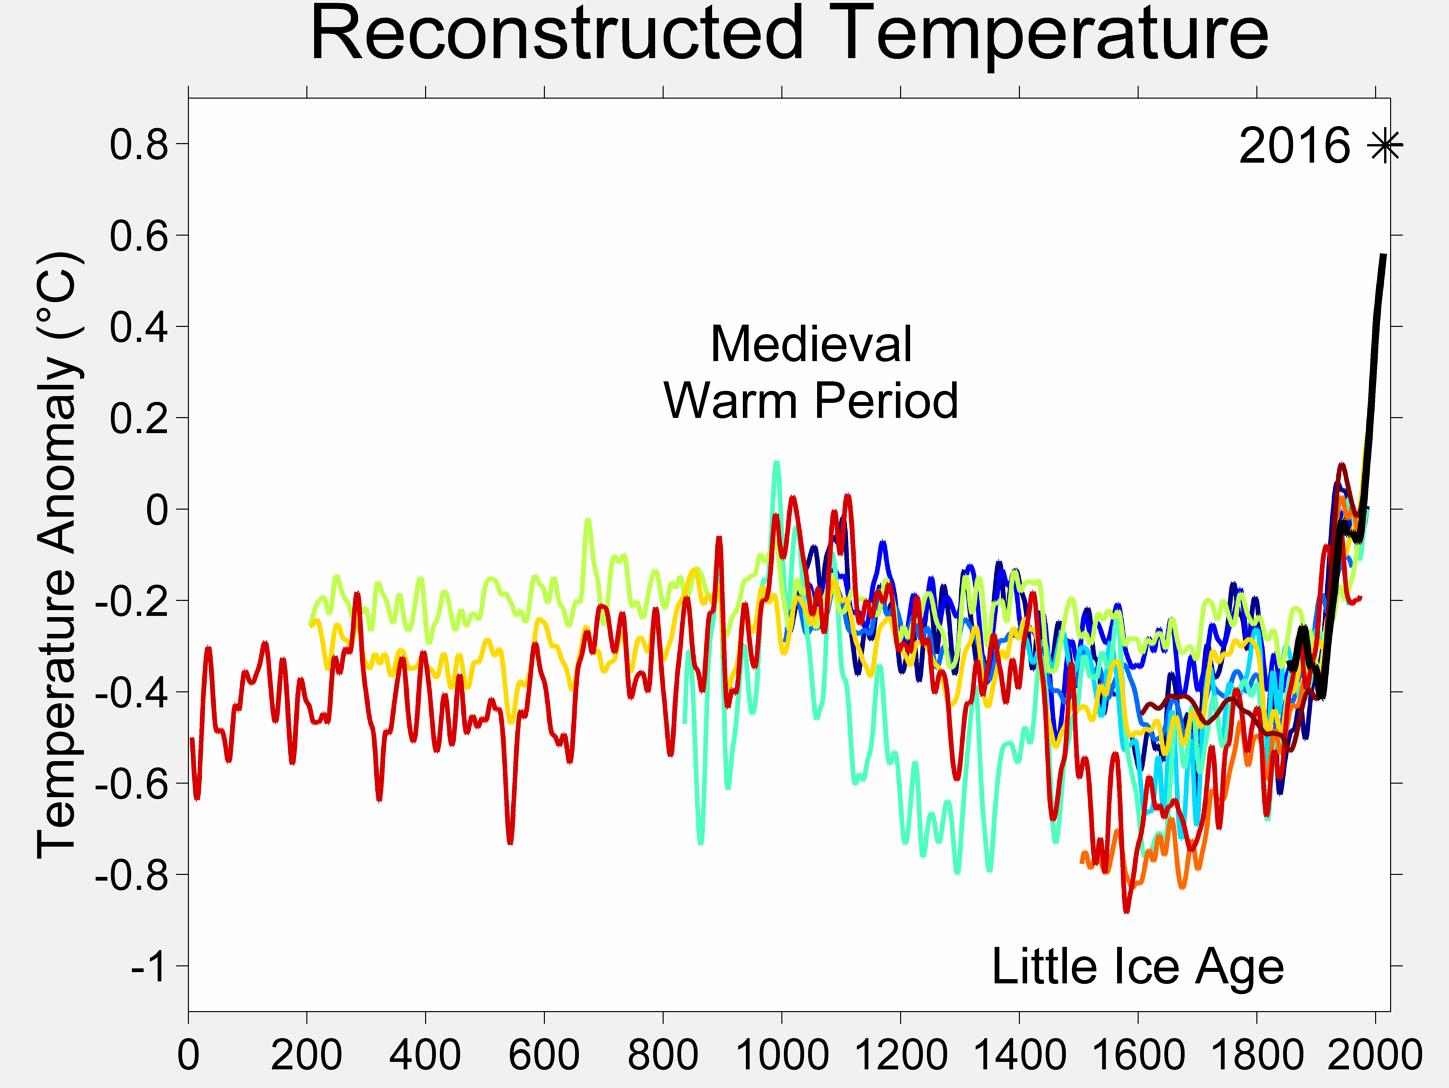
The warming trend will surely continue for a while; however, technological advancements are occurring at a much quicker rate than the 0.4°C per century increase in global temperatures.

Additionally, there is a finite quantity of fossil fuel reserves; thus, we have no other choice than to invent our way out of out this. However, solar panels and wind turbines are going to appear to have been very primitive attempts at advancing energy technology. The question is will it be hydrogen fuel cells, anti-matter, or some unheard of and extraordinary discovery that will provide the energy of the future.

Mercedes-Benz F125! gullwing fuel cell concept leaks ahead of Frankfurt


Printer Friendly | Permalink | Reply | Top
 
Viking12 Donating Member (1000+ posts) Send PM | Profile | Ignore Tue Sep-20-11 08:38 PM
Response to Reply #1
3. What buttcrack did you pull the "0.4°C per century" figure from?
Printer Friendly | Permalink | Reply | Top
 
Cool Logic Donating Member (1000+ posts) Send PM | Profile | Ignore Tue Sep-20-11 09:09 PM
Response to Reply #3
4. Actually, it was from ten historical butt-cracks...
The (10) reconstructions used, in order from oldest to most recent publication are:
(dark blue 1000-1991): P.D. Jones, K.R. Briffa, T.P. Barnett, and S.F.B. Tett (1998). , The Holocene, 8: 455-471. doi:10.1191/095968398667194956
(blue 1000-1980): M.E. Mann, R.S. Bradley, and M.K. Hughes (1999). , Geophysical Research Letters, 26(6): 759-762.
(light blue 1000-1965): Crowley and Lowery (2000). , Ambio, 29: 51-54. Modified as published in Crowley (2000). , Science, 289: 270-277. doi:10.1126/science.289.5477.270
(lightest blue 1402-1960): K.R. Briffa, T.J. Osborn, F.H. Schweingruber, I.C. Harris, P.D. Jones, S.G. Shiyatov, S.G. and E.A. Vaganov (2001). , J. Geophys. Res., 106: 2929-2941.
(light turquoise 831-1992): J. Esper, E.R. Cook, and F.H. Schweingruber (2002). , Science, 295(5563): 2250-2253. doi:10.1126/science.1066208.
(green 200-1980): M.E. Mann and P.D. Jones (2003). , Geophysical Research Letters, 30(15): 1820. doi:10.1029/2003GL017814.
(yellow 200-1995): P.D. Jones and M.E. Mann (2004). , Reviews of Geophysics, 42: RG2002. doi:10.1029/2003RG000143
(orange 1500-1980): S. Huang (2004). , Geophys. Res Lett., 31: L13205. doi:10.1029/2004GL019781
(red 1-1979): A. Moberg, D.M. Sonechkin, K. Holmgren, N.M. Datsenko and W. Karlén (2005). , Nature, 443: 613-617. doi:10.1038/nature03265
(dark red 1600-1990): J.H. Oerlemans (2005). , Science, 308: 675-677. doi:10.1126/science.1107046
(black 1856-2004): Instrumental data was jointly compiled by the w:Climatic Research Unit and the UK Meteorological Office Hadley Centre. Global Annual Average data set TaveGL2v <2> was used.

Printer Friendly | Permalink | Reply | Top
 
Viking12 Donating Member (1000+ posts) Send PM | Profile | Ignore Wed Sep-21-11 06:02 AM
Response to Reply #4
5. Thank you for waving your flag of ignorance
Now I will know better than waste my time reading your posts.
Printer Friendly | Permalink | Reply | Top
 
Cool Logic Donating Member (1000+ posts) Send PM | Profile | Ignore Wed Sep-21-11 01:21 PM
Response to Reply #5
7. Well, at least you are aware of your limitations.
Printer Friendly | Permalink | Reply | Top
 
kristopher Donating Member (1000+ posts) Send PM | Profile | Ignore Tue Sep-20-11 06:16 PM
Response to Original message
2. There is no worse source for future analysis of renewable growth than the EIA.
Edited on Tue Sep-20-11 06:17 PM by kristopher
The place where renewables have their greatest potential is in precisely the place where fossil fuels are experiencing virtually all of their growth - the developing countries.

When they fund development of a coal plant, they get a single coal plant from a mature supply chain and manufacturing base. The competitiveness of the end use electricity is only affected by declining fuel reserves and rising fuel costs.

When they fund renewables, they create demand for new manufacturing infrastructure and an expanded supply chain that results in steadily declining end user electricity costs.

When a coal plant is purchased it requires a very large, coordinated effort across several political and economic fronts.

When a solar panel is purchased it requires increasingly fewer people to coordinate and agree on the decision.

When these two factors combine in a rapidly growing energy market where those facing potential sunk costs are not creating artificial obstacles there really is only one, inevitable outcome. The only question remaining is the pace of the transition.

Note: The UN IEA (international energy agency) is only marginally better than the US EIA (energy information agency), but since the UN recently founded IRENA - the International RENewable Energy Agency - there seems to be a change in perspective at the IEA.

Solar May Produce Most of World’s Power by 2060, IEA Says
By Ben Sills
Aug 29, 2011 8:10 AM GMT-0400


Solar generators may produce the majority of the world’s power within 50 years, slashing the emissions of greenhouse gases that harm the environment, according to a projection by the International Energy Agency.

Photovoltaic and solar-thermal plants may meet most of the world’s demand for electricity by 2060 -- and half of all energy needs -- with wind, hydropower and biomass plants supplying much of the remaining generation, Cedric Philibert, senior analyst in the renewable energy division at the Paris-based agency, said in an Aug. 26 phone interview.

“Photovoltaic and concentrated solar power together can become the major source of electricity,” Philibert said. “You’ll have a lot more electricity than today but most of it will be produced by solar-electric technologies.”

The solar findings, set to be published in a report later this year, go beyond the IEA’s previous forecast, which envisaged the two technologies meeting about 21 percent of the world’s power needs in 2050. The scenario suggests investors able to pick the industry’s winners may reap significant returns as the global economy shifts away from fossil fuels....

http://www.bloomberg.com/news/2011-08-29/solar-may-produce-most-of-world-s-power-by-2060-iea-says.html
Printer Friendly | Permalink | Reply | Top
 
Viking12 Donating Member (1000+ posts) Send PM | Profile | Ignore Wed Sep-21-11 11:11 AM
Response to Reply #2
6. As Joe Romm points out, there are many methodological flaws in the IEA
For instance, the EIA all but ignores the obvious evidence that oil production is peaking and projects, “the price reaches $108 per barrel in 2020 and $125 per barrel in 2035 in the IEO2011 Reference case.” http://thinkprogress.org/romm/2011/09/21/324424/deniers-fantasy-world-eia-projects-40-rise-in-co2-emissions-by-2035/
Printer Friendly | Permalink | Reply | Top
 
txlibdem Donating Member (1000+ posts) Send PM | Profile | Ignore Thu Sep-22-11 09:16 AM
Response to Original message
8. Forbes says solar PV installations will grow 50 times the current amount in the next 4 years
in Renewable Energy World, was about the publication of a comprehensive map of operational and pre-operational utility-scale solar PV power plants in the U.S. and Canada. This easy to grasp picture shows that there is presently 482.63MW of generating capacity among 35 facilities. These range in size from 2MW to the largest, the Sarnia PV Power Plant in Ontario, Canada, at 97MW. The more interesting picture, however, is the list of under-construction and under-development plants. This list shows an astounding generating capacity of more than 16.6GW to be built in the next 4 years. That’s an increase of 50 times the current capacity.

http://www.ontility.com/resources/ontility-resources/blog/utility-scale-pv-a-astounding-growth-projections.html


Note that these figures represent only Solar PV on a utility scale and does not include solar-thermal or residential solar installs and covers both the US and Canada only.
Printer Friendly | Permalink | Reply | Top
 
DU AdBot (1000+ posts) Click to send private message to this author Click to view 
this author's profile Click to add 
this author to your buddy list Click to add 
this author to your Ignore list Sun May 05th 2024, 09:06 AM
Response to Original message
Advertisements [?]
 Top

Home » Discuss » Topic Forums » Environment/Energy Donate to DU

Powered by DCForum+ Version 1.1 Copyright 1997-2002 DCScripts.com
Software has been extensively modified by the DU administrators


Important Notices: By participating on this discussion board, visitors agree to abide by the rules outlined on our Rules page. Messages posted on the Democratic Underground Discussion Forums are the opinions of the individuals who post them, and do not necessarily represent the opinions of Democratic Underground, LLC.

Home  |  Discussion Forums  |  Journals |  Store  |  Donate

About DU  |  Contact Us  |  Privacy Policy

Got a message for Democratic Underground? Click here to send us a message.

© 2001 - 2011 Democratic Underground, LLC