| Latest | Greatest | Lobby | Journals | Search | Options | Help | Login |
|
|
|
This topic is archived. |
| Home » Discuss » Topic Forums » Environment/Energy |
|
| pscot
|
Thu Jul-07-11 09:23 PM Original message |
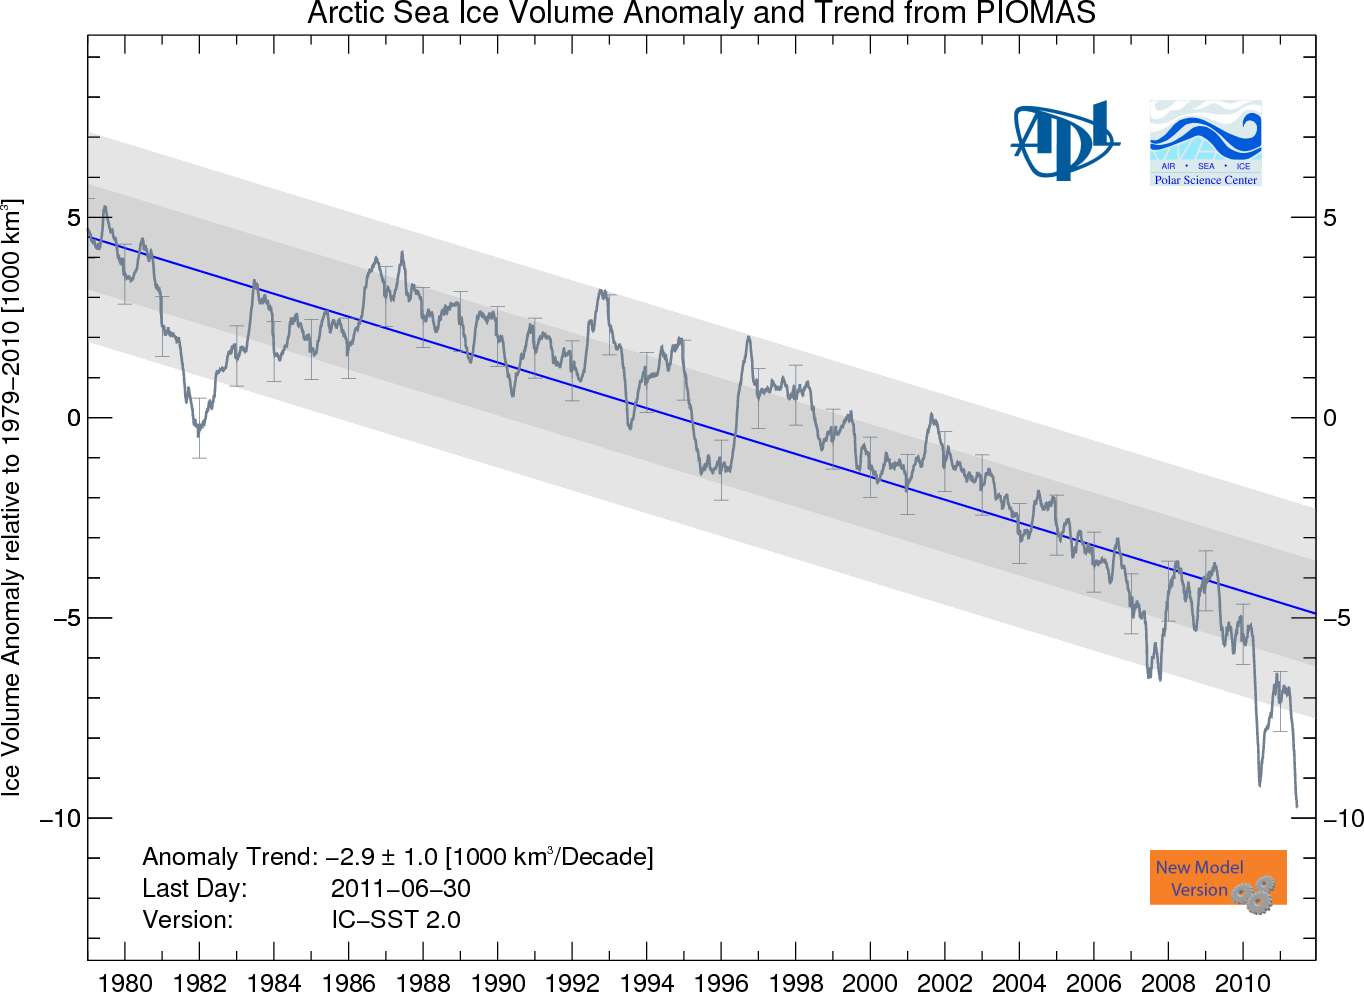
| Breakout |
| Printer Friendly | Permalink | | Top |
| Drale
|
Thu Jul-07-11 09:25 PM Response to Original message |
| 1. I'm not a climate change denier but I think it would be interesting |
| Printer Friendly | Permalink | | Top |
| Jackpine Radical
|
Thu Jul-07-11 09:29 PM Response to Reply #1 |
| 2. Yeah, I'm pretty sure the Greenland Viking colonists were keeping tabs |
| Printer Friendly | Permalink | | Top |
| Drale
|
Thu Jul-07-11 09:31 PM Response to Reply #2 |
| 3. That would be a crazy stone tab to find wouldn't it lol. /nt |
| Printer Friendly | Permalink | | Top |
| Jackpine Radical
|
Thu Jul-07-11 10:23 PM Response to Reply #3 |
| 6. Yes, here it is-- |
| Printer Friendly | Permalink | | Top |
| pa28
|
Thu Jul-07-11 09:33 PM Response to Original message |
| 4. That's what a stock chart looks like before a major leg down or bankruptcy. |
| Printer Friendly | Permalink | | Top |
| pscot
|
Thu Jul-07-11 09:43 PM Response to Reply #4 |
| 5. Just find a way to short Western Civ |
| Printer Friendly | Permalink | | Top |
| Systematic Chaos
|
Fri Jul-08-11 03:20 PM Response to Original message |
| 7. The sooner all that damn ice is gone, the sooner they can drill for oil and gas! |
| Printer Friendly | Permalink | | Top |
| DU
AdBot (1000+ posts) |
Tue May 07th 2024, 12:02 PM Response to Original message |
| Advertisements [?] |
| Top |
| Home » Discuss » Topic Forums » Environment/Energy |
|
Powered by DCForum+ Version 1.1 Copyright 1997-2002 DCScripts.com
Software has been extensively modified by the DU administrators
Important Notices: By participating on this discussion board, visitors agree to abide by the rules outlined on our Rules page. Messages posted on the Democratic Underground Discussion Forums are the opinions of the individuals who post them, and do not necessarily represent the opinions of Democratic Underground, LLC.
Home | Discussion Forums | Journals | Store | Donate
About DU | Contact Us | Privacy Policy
Got a message for Democratic Underground? Click here to send us a message.
© 2001 - 2011 Democratic Underground, LLC