Democratic Underground Latest Greatest Lobby Journals Search Options Help Login
Google

Time to Sell That Ocean Front Property? New Study on Sea Level Rise

Printer-friendly format Printer-friendly format
Printer-friendly format Email this thread to a friend
Printer-friendly format Bookmark this thread
This topic is archived.
Home » Discuss » Topic Forums » Environment/Energy Donate to DU
 
wtmusic Donating Member (1000+ posts) Send PM | Profile | Ignore Wed Jun-22-11 12:28 PM
Original message
Time to Sell That Ocean Front Property? New Study on Sea Level Rise
http://2.bp.blogspot.com/-kOhbVdL03RA/TgCaAdAFssI/AAAAAAAAAU8/t3XGxzjzL2g/s320/Calvin+last+night+on+beach+at+OKI_30+July+2010.jpg

"The rate of sea level rise along the U.S. Atlantic coast is greater now than at any time in the past 2,000 years, according to a new study published this week in the journal Proceedings of the National Academy of Sciences (PNAS).

The study suggests a consistent link between changes in global mean surface temperature and sea level.

<>

'It's especially valuable for anticipating the evolution of coastal systems,' he says, 'in which more than half the world's population now lives.'"

http://theenergycollective.com/greenskeptic/59895/time-sell-ocean-front-property-new-study-sea-level-rise?utm_source=feedburner&utm_medium=feed&utm_campaign=The+Energy+Collective+%28all+posts%29
Printer Friendly | Permalink |  | Top
KurtNYC Donating Member (1000+ posts) Send PM | Profile | Ignore Wed Jun-22-11 12:52 PM
Response to Original message
1. Somebody has models of which real estate will BENEFIT
from global warming but they are tough to find. A good model could show where there is property that WILL be ocean front or ocean view, places where the growing season gets longer and then allows better crops and which areas will command a higher price as tornadoes, hurricanes and temperature extremes increase.

Printer Friendly | Permalink |  | Top
 
The Croquist Donating Member (1000+ posts) Send PM | Profile | Ignore Wed Jun-22-11 02:09 PM
Response to Original message
2. Too bad the study is a joke as is the whole man made global warming panic
Data is important. So is not panicking before looking at the facts. I look at the facts. Sea level has been rising for the last 22,000 years at a rate of almost 6 mm per year. To expect it to stop rising because we want it to is stupid. This study claims (using proxy data) that it was rising by over 2 mm per year for the last 2000 years. Correct me if I'm wrong, but 2 mm is about a third of what it has averaged over the last 22,000 years. Over the last 30 years or so it's been rising at about 3 mm per year. It's lower today then it was 16 months ago. 16 months means nothing. 22,000 years means allot.

Feel free to panic. It's what many people do best. That and hurling insults when they are confronted by facts.

PS: Got any ocean front property to sell?
Printer Friendly | Permalink |  | Top
 
wtmusic Donating Member (1000+ posts) Send PM | Profile | Ignore Wed Jun-22-11 02:34 PM
Response to Reply #2
3. Sea level has been stable or his risen by about .6mm/yr over the past two millennia
Edited on Wed Jun-22-11 02:35 PM by wtmusic
but since the late nineteenth century the rate has quadrupled.

"Based on our inferred planetary energy imbalance, we conclude that the rate of sea level rise is likely to accelerate during the next several years. Reasons for that conclusion are as follows.

First, the contribution of thermal expansion to sea level is likely to increase above recent rates. The nearly constant rate of sea level rise since 1993 masks the fact that thermal expansion must have been less in the Argo era than in the prior decade, when ice melt was less but sea level rose 3 mm/year. Solar minimum and a diminishing Pinatubo rebound effect both contributed to a declining rate of thermal expansion during the past several years. But the Pinatubo effect is now essentially spent and solar irradiance change should now work in the opposite sense.

Second, the rate of ice melt is likely to continue to accelerate. Planetary energy imbalance now is positive, substantial, and likely to increase as greenhouse gases and solar irradiance increase. Thus, despite year-to-year fluctuations, global temperature will increase this decade and there will be a substantial flux of energy into the ocean. Increasing ocean heat content provides energy for melting sea ice and ice shelves. Sea ice protects the ice sheets from heating and ice shelves mechanically buttress the ice sheets. It has been argued that loss of these protections may be the most important factor causing more rapid discharge from ice sheets to the ocean (Hansen, 2005, 2007)."

http://thinkprogress.org/romm/2011/04/20/207920/hansen-sea-level-rise-faustian-aerosol-bargain/

JPL calculates 1-foot rise by 2050:

"The authors conclude that, if current ice sheet melting rates continue for the next four decades, their cumulative loss could raise sea level by 15 centimeters (5.9 inches) by 2050. When this is added to the predicted sea level contribution of 8 centimeters (3.1 inches) from glacial ice caps and 9 centimeters (3.5 inches) from ocean thermal expansion, total sea level rise could reach 32 centimeters (12.6 inches). While this provides one indication of the potential contribution ice sheets could make to sea level in the coming century, the authors caution that considerable uncertainties remain in estimating future ice loss acceleration."

http://thinkprogress.org/romm/2011/03/10/207664/jpl-greenland-antarctica-ice-sheet-mass-loss-accelerating-sea-level-rise-1-foot-by-2050/
Printer Friendly | Permalink |  | Top
 
pscot Donating Member (1000+ posts) Send PM | Profile | Ignore Wed Jun-22-11 02:56 PM
Response to Reply #2
4. I'm sure you can explain this away
Printer Friendly | Permalink |  | Top
 
OnlinePoker Donating Member (837 posts) Send PM | Profile | Ignore Wed Jun-22-11 03:09 PM
Response to Reply #4
5. Link would be nice. n/t
Printer Friendly | Permalink |  | Top
 
pscot Donating Member (1000+ posts) Send PM | Profile | Ignore Wed Jun-22-11 03:30 PM
Response to Reply #5
6. Of course
http://www.realclimate.org/index.php/archives/2011/06/2000-years-of-sea-level/#more-7947

Scroll down. The article also notes the 120 meter rise in sea levels that happened at the end of the last glaciation some 20,000 years ago. Croquist doesn't like to talk about that, since it doesn't fit in with his 2-cm-per-century schtick.
Printer Friendly | Permalink |  | Top
 
wtmusic Donating Member (1000+ posts) Send PM | Profile | Ignore Wed Jun-22-11 06:28 PM
Response to Reply #6
7. Nice graph.
It's suddenly gotten very quiet in here...
Printer Friendly | Permalink |  | Top
 
Name removed Donating Member (0 posts) Send PM | Profile | Ignore Wed Jun-22-11 06:48 PM
Response to Reply #7
8. Deleted message
Sub-thread removed by moderator. Click here to review the message board rules.
 
The Croquist Donating Member (1000+ posts) Send PM | Profile | Ignore Wed Jun-22-11 08:29 PM
Response to Reply #6
10. The Croquist doesn't like to talk about the 120 meter sea level increase?
The Croquist brought it up.

First of all they aren't using real data they are using proxy data. By definition proxy data is not as trust worthy as exact measurements. If you don't believe me I think you should look at Ken Briffa's tree ring data that shows a temperature decline since 1960. I know of nobody that claims that the temperature has dropped since 1960 but that is what Briffa's analysis shows. As I've said previously, if it's been shown to be wrong for 50 years what makes you think it is trustworthy?

Second of all the fact is that sea level has risen at a much faster rate before the industrial age. It has averaged almost 3 times as fast and, at times ten or more times as fast long before significant human induced CO2. Accurate measurements of CO2 in the atmosphere only date back to the 1950's but looking at proxy data (All hail proxy data!) shows that in 1700 it was about 275 ppm.

1700 275
1750 277
1800 282
1850 285
1900 295
1950 310
2000 360

http://www.climate.unibe.ch/~joos/images/sres_jan99/

Looking at the numbers you can see that significant CO2 increase started after 1950 yet the study claims that sea level started rising much faster around 1800.

Since the late 19th century, however, sea level has risen by more than 2 millimeters per year on average, which is the steepest rate for more than 2,100 years.

Perhaps you can explain why the sea level increase started 150 years before we started dumping so much CO2 in the atmosphere.
Printer Friendly | Permalink |  | Top
 
Viking12 Donating Member (1000+ posts) Send PM | Profile | Ignore Wed Jun-22-11 08:51 PM
Response to Reply #10
12. math for grown ups.
Edited on Wed Jun-22-11 09:02 PM by Viking12
Printer Friendly | Permalink |  | Top
 
The Croquist Donating Member (1000+ posts) Send PM | Profile | Ignore Wed Jun-22-11 10:32 PM
Response to Reply #12
14. Wow Viking12 your powers of copy and paste are amazing!
Lets see in my first post:

I commented that for the last 22,000 years sea level rise has averaged about 6 mm per year.
Nobody has disputed that.
I commented that the study claims that for the last 2,000 years sea level rise has averaged about 2 mm per year.
Nobody has disputed that.
I commented that for the last 30 years sea level rise has averaged about 3 mm per year.
Nobody has disputed that.
I commented that for sea level has dropped in the last 16 months but it was meaningless.

In my third post:
I commented that proxy data is not as reliable as actual measurements.
Nobody has disputed that.
I asked why the rate of sea level rise accelerated, according to the study, 150 years before humans significantly increased the amount of CO2 in the atmosphere.
Nobody has responded to that question.

You respond with a Tamino post that shows that the rate of sea level has increased. Interestingly enough he questions the Houston & Dean paper because it uses only US data from 57 sites. Perhaps you failed to notice that the study in question on this thread used measurements from just two locations, Massachusetts and North Carolina. So one study is no good because it uses 57 sites in either the US or US territories covering thousands of miles and the other one is good because it uses two sites in the US a few hundred miles apart.

I wonder what the difference is.
Printer Friendly | Permalink |  | Top
 
muriel_volestrangler Donating Member (1000+ posts) Send PM | Profile | Ignore Tue Jun-28-11 06:38 PM
Response to Reply #14
44. I dispute your claim "2mm/yr average over 2000 years"; it's *0.2mm/yr*
As the graph in #4 shows, it's risen roughly 0.4m in 2000 years. That's 0.2mm per year. It's important to get your decimal point right. So the rise over the last 30 years is about 15 times the average over 2000 years - and about 30 times the average from 0AD to 1850.

And your comparison with an average including the large rise at the end of the last ice age seems such an incredibly stupid thing to say that I suspect people are dumbstruck that you attempted to bring it up. Are you really saying that we shouldn't worry about an extra sea level (or temperature, for that matter) rise on top of what happened when the earth came out of the ice age? When the human population was minute, and we had no permanent dwellings anywhere, let alone agriculture or civilisation?
Printer Friendly | Permalink |  | Top
 
guardian Donating Member (1000+ posts) Send PM | Profile | Ignore Thu Jun-23-11 04:43 PM
Response to Reply #12
30. Notice how the data points pre-1940
Edited on Thu Jun-23-11 04:44 PM by guardian
have a smoother curve and the variance bars have about a 5X tighter deviation above/below the mean. This either indicates that the older data is more precise (not likely). Or that the older data is from fewer and less reliable data sources (probably the case). Thus this graph is misleading because it conflates two (or more) sets of disparate data.

A common technique used to lie with statistics. But I'm sure 'grown ups' would recognize this.


Printer Friendly | Permalink |  | Top
 
athena Donating Member (771 posts) Send PM | Profile | Ignore Sun Jun-26-11 04:38 AM
Response to Reply #30
42. Sorry, but you're wrong.
The page the plot has been posted from explains that it shows the slope of a linear fit to another plot as the starting point of the fit is varied. In other words, the vertical axis is the slope of the linear fit, and the horizontal axis is the cutoff date for the data included in the fit. Since all the fits are based on the same data, the points are correlated, which is why the error bars are larger than the fluctuation of the points would suggest. The earlier points have smaller error bars because they are based on more data. They also fluctuate less than the later points because they are more correlated. (Going from one point to the next, a smaller fraction of the data is excluded on the left than on the right.)

The page is trying to argue that a previous paper claiming a deceleration of the rate of sea level rise is misleading because of the apparently arbitrary starting date it used. The figure was therefore not exactly relevant to this discussion. But your response to it is what I would call "authoritative B.S." The authoritative tone you used does not make it correct.
Printer Friendly | Permalink |  | Top
 
athena Donating Member (771 posts) Send PM | Profile | Ignore Sun Jun-26-11 04:41 AM
Response to Reply #42
43. FWIW, the original plot was this one:
Printer Friendly | Permalink |  | Top
 
kristopher Donating Member (1000+ posts) Send PM | Profile | Ignore Thu Jun-23-11 12:48 AM
Response to Reply #10
16. When you type, are you using energy from lunch yesterday or the snack this afternoon?
Edited on Thu Jun-23-11 12:50 AM by kristopher
Your arguing tactic is similar to quibbling about something like that when the discussion is "how does our body process and use energy?"

I chose that as an example because the number of variables is limited to either the energy stored in fat or the energy in the food being processed now. We might not know which energy stream moves which particular muscle, but there is no question that the calories we take in are used to power us. You base your argumentative approach on what is equivalent to saying "if you can't prove it was energy from the linguine yesterday then I can't accept that food powers muscles".

All you are doing is trampling around in the science making a fool of yourself by pretending you actually understand anything you are saying. I say that in candor and with confidence that you do not, because if you did, you would understand that there are a lot of inputs into climatic conditions that must be part of explaining the full range of observed data. Data that unequivocally - UNEQUIVOCALLY - that tells us the warming of the planet brought on by excessive anthropogenic CO2 is threatening our species.

ALL of the arguments you pretend to understand are paid for by carbon emitting industry and manufactured in "think tanks" as sophistry designed for morons.


Theory:
Rearguard of Modernity
Peter Jacques in the journal Global Environmental Politics

Environmental skepticism denies the reality and importance of mainstream global environmental problems. However, its most important challenges are in its civic claims which receive much less attention. These civic claims defend the basis of ethical authority of the dominant social paradigm. The article explains how political values determine what skeptics count as a problem. One such value described is “deep anthropocentrism,” or the attempt to split human society from non-human nature and reject ecology as a legitimate field of ethical concern. This bias frames what skeptics consider legitimate knowledge. The paper then argues that the contemporary conservative countermovement has marshaled environmental skepticism to function as a rearguard for a maladaptive set of core values that resist public efforts to address global environmental sustainability. As such, the paper normatively argues that environmental skepticism is a significant threat to efforts to achieve sustainability faced by human societies in a globalizing world.

Download here: http://ucf.academia.edu/PeterJacques/Papers/71775/Rearguard-of-Modernity


Study to test theory:
The Organization of Denial: Conservative Think Tanks and Environmental Scepticism
Peter Jacques Co-authored with Riley E. Dunlap and Mark Freeman published in the journal Environmental Politics, June 2008

Environmental scepticism denies the seriousness of environmental problems, and self-professed 'sceptics' claim to be unbiased analysts combating 'junk science'. This study quantitatively analyses 141 English-language environmentally sceptical books published between 1972 and 2005. We find that over 92 per cent of these books, most published in the US since 1992, are linked to conservative think tanks (CTTs). Further, we analyse CTTs involved with environmental issues and find that 90 per cent of them espouse environmental scepticism. We conclude that scepticism is a tactic of an elite-driven counter-movement designed to combat environmentalism, and that the successful use of this tactic has contributed to the weakening of US commitment to environmental protection.
download here: http://ucf.academia.edu/PeterJacques/Papers

Do you enjoy being a "Koch Sucker"?

Printer Friendly | Permalink |  | Top
 
The Croquist Donating Member (1000+ posts) Send PM | Profile | Ignore Thu Jun-23-11 11:39 AM
Response to Reply #16
18. Sorry but I don't understand your logic.
I think you are referring to the point I made about sea level rising before significant CO2 was introduced by man but like I said, I don't understand your point.

All you are doing is trampling around in the science making a fool of yourself by pretending you actually understand anything you are saying. I say that in candor and with confidence that you do not, because if you did, you would understand that there are a lot of inputs into climatic conditions that must be part of explaining the full range of observed data. Data that unequivocally - UNEQUIVOCALLY - that tells us the warming of the planet brought on by excessive anthropogenic CO2 is threatening our species.

There are lots of things I don't understand. One of them is how the data in this study show that man induced CO2 caused sea level increase when it started to occur 150 years before significant man induced CO2 increases?

ALL of the arguments you pretend to understand are paid for by carbon emitting industry and manufactured in "think tanks" as sophistry designed for morons.

That is simply untrue. The supposed huge contributions from "carbon emitting industry" is minuscule compared to what is provided by governments around the world and the vast majority goes to foundations that host a seminar not directly to scientists. Climate scientists are dependent on federal grants to make a living. No crises, no grant money. Does that make them corrupt"

As for your quotes from Peter Jacques, I'm not impressed. He's long on big words but short on substance. He condemns Orlando but profits from it. I doubt he cares that the USHCN data is a joke. Like you he would rather hurl insults then try and truly understand the issue.
Printer Friendly | Permalink |  | Top
 
kristopher Donating Member (1000+ posts) Send PM | Profile | Ignore Thu Jun-23-11 01:20 PM
Response to Reply #18
20. Please don't insult us by pretending you actually care about the data.
You aren't engaged in "trying to understand" anything, you are engaged in a political game of "gotcha" where the larger truth means absolutely nothing to you.
Printer Friendly | Permalink |  | Top
 
The Croquist Donating Member (1000+ posts) Send PM | Profile | Ignore Thu Jun-23-11 02:52 PM
Response to Reply #20
22. I not only care about the data but I collect it
For example. I track GISS, UAH, RSS, NSIDC and IRAC-JAXA data.

I actually got kicked off the NASA site in December 2008 for downloading excessive amounts of data. They thought I was an "automated agent". It took me three weeks to get back on line and only then because I appealed to Dr. Robert B. Schmunk who was very cooperative.

I also track changes in the GISS data. For example in August 2009 the January 1880 temperature anomaly was +0.50 C. In November 2009 it dropped to +0.49 C through January 2010. In February 2010 it dropped to -0.02 C. As of June 2011 it is -0.01 C. Now they added allot more data but I thought that their "highly accurate data" was off by half a degree. As I said, the data sucks.

I've looked at Anthony Watts' Surface Station audit. He is ridiculed and condemned by many on this site but his findings are devastating to anyone with an open mind and what's more are documented. Have you ever visited his site or is that "beneath you"?

Would you like me to send you the data?

Printer Friendly | Permalink |  | Top
 
kristopher Donating Member (1000+ posts) Send PM | Profile | Ignore Thu Jun-23-11 03:02 PM
Response to Reply #22
24. As I said "Please don't insult us by pretending you actually care about the data"
Your efforts really just prove my point. "You aren't engaged in "trying to understand" anything, you are engaged in a political game of "gotcha" where the larger truth means absolutely nothing to you."

Theory:
Rearguard of Modernity

in the journal Global Environmental Politics

Environmental skepticism denies the reality and importance of mainstream global environmental problems. However, its most important challenges are in its civic claims which receive much less attention. These civic claims defend the basis of ethical authority of the dominant social paradigm. The article explains how political values determine what skeptics count as a problem. One such value described is “deep anthropocentrism,” or the attempt to split human society from non-human nature and reject ecology as a legitimate field of ethical concern. This bias frames what skeptics consider legitimate knowledge. The paper then argues that the contemporary conservative countermovement has marshaled environmental skepticism to function as a rearguard for a maladaptive set of core values that resist public efforts to address global environmental sustainability. As such, the paper normatively argues that environmental skepticism is a significant threat to efforts to achieve sustainability faced by human societies in a globalizing world.

Download here: http://ucf.academia.edu/PeterJacques/Papers/71775/Rearguard-of-Modernity


Study to test theory:
The Organization of Denial: Conservative Think Tanks and Environmental Scepticism

Co-authored with Riley E. Dunlap and Mark Freeman published in the journal Environmental Politics, June 2008

Environmental scepticism denies the seriousness of environmental problems, and self-professed 'sceptics' claim to be unbiased analysts combating 'junk science'. This study quantitatively analyses 141 English-language environmentally sceptical books published between 1972 and 2005. We find that over 92 per cent of these books, most published in the US since 1992, are linked to conservative think tanks (CTTs). Further, we analyse CTTs involved with environmental issues and find that 90 per cent of them espouse environmental scepticism. We conclude that scepticism is a tactic of an elite-driven counter-movement designed to combat environmentalism, and that the successful use of this tactic has contributed to the weakening of US commitment to environmental protection.
download here: http://ucf.academia.edu/PeterJacques/Papers


Maybe you should use a dictionary this time.


Printer Friendly | Permalink |  | Top
 
The Croquist Donating Member (1000+ posts) Send PM | Profile | Ignore Thu Jun-23-11 03:09 PM
Response to Reply #24
25. Why don't you call by bluff and ask me to send you the data?
I'll be only to happy to. What do you want first?

By the way, I noticed that you neglected to respond to my question regarding the audit that Anthony Watts lead. Is it just possible that you are the one that isn't "trying to understand".
Printer Friendly | Permalink |  | Top
 
kristopher Donating Member (1000+ posts) Send PM | Profile | Ignore Thu Jun-23-11 03:27 PM
Response to Reply #25
26. Have you ever had a discussion with a Creationist about evolution?
That is the category your "science" falls into. It is gibberish as far as being a meaningful reflection of either reality or the truth.

Your appeal to knowledge and expertise based on your collection of raw data is like a tin-ear guitar player wannabe that collects guitars. Can't play a three chord progression without bungling it, mind you; but all that time and money sunk into those guitars must mean something, right?

BTW I notice that you've neglected to respond to the actual content of Jacques papers twice now. I suppose they make you uncomfortable and it is just possible you don't want to understand.
Printer Friendly | Permalink |  | Top
 
The Croquist Donating Member (1000+ posts) Send PM | Profile | Ignore Thu Jun-23-11 04:57 PM
Response to Reply #26
31. I don't think I have had a conversation with a creationist regarding evolution
Edited on Thu Jun-23-11 05:03 PM by The Croquist
I tend to stear conversations away from religion. I've found that they can get quite heated and when they find out I'm an atheist they tend to want to "save" me. The most recent time was last weekend.

Your appeal to knowledge and expertise based on your collection of raw data is like a tin-ear guitar player wannabe that collects guitars.

So what is wrong with looking at raw data and for the most part I don't look at raw data I look at adjusted data.

Good call by the way regarding music. I'm pretty much tone deaf. If I wasn't such a nice guy I'd serenade you but I believe that would qualify as cruel and unusual punishment.

In regards to Peter Jacques. I did respond but only briefly. This is what I posted:

As for your quotes from Peter Jacques, I'm not impressed. He's long on big words but short on substance. He condemns Orlando but profits from it. I doubt he cares that the USHCN data is a joke. Like you he would rather hurl insults then try and truly understand the issue.

I didn't say much because he didn't impress me. Frankly it bothered me. I went to his UCF website and read his biography. He is a political science professor who seems to be obsessed with the environment. There are connections but to build a curriculum around it seems a bit weird as are his papers.

OK. Now I've answered your question. Why don't you address my questions:

Why did sea level increase 150 years before we started dumping so much CO2 in the atmosphere?

Have you ever visited Watts' site or is that "beneath you"?

Would you like me to send you data?

Here's a new question:
Does it make you feel better throwing out insults instead of actually addressing the issue?
Printer Friendly | Permalink |  | Top
 
kristopher Donating Member (1000+ posts) Send PM | Profile | Ignore Thu Jun-23-11 05:06 PM
Response to Reply #31
33. Jacques Nails the "sceptics' for the Koch Suckers that they are.
That is undoubtedly why it bothered you.

And yes, pretending you or Watt are actually engaged in a debate about science is beneath me. If you want to be a tool for the fossil fuel industry that is your choice, I'm not required to pretend there is any actual meaning in your nonsense.
Printer Friendly | Permalink |  | Top
 
The Croquist Donating Member (1000+ posts) Send PM | Profile | Ignore Fri Jun-24-11 07:53 AM
Response to Reply #33
36. Apparently looking at facts is beneath you
Go ahead and run you life by emotions. Don't ever let facts get in the way of your beliefs.

In a previous post you asked me to comment on Peter Jacques. I repeated my previous comment and elaborated. I also asked you to answer my questions. They were:

Why did sea level increase 150 years before we started dumping so much CO2 in the atmosphere?
Have you ever visited Watts' site or is that "beneath you"?
Would you like me to send you data?
Does it make you feel better throwing out insults instead of actually addressing the issue?

The best I can tell you only answered the last one "Does it make you feel better throwing out insults instead of actually addressing the issue?" and that by throwing out more insults. That's really sad.

By the way I am not a Koch sucker. You however are advocating a policy that will kill hundreds of millions of people. How does that make you feel?
Printer Friendly | Permalink |  | Top
 
The Croquist Donating Member (1000+ posts) Send PM | Profile | Ignore Thu Jun-23-11 05:00 PM
Response to Reply #26
32. Self Delete
Edited on Thu Jun-23-11 05:05 PM by The Croquist
Dupe Post
Printer Friendly | Permalink |  | Top
 
meow mix Donating Member (1000+ posts) Send PM | Profile | Ignore Fri Jun-24-11 08:39 AM
Response to Reply #2
39. rush!
welcome!
Printer Friendly | Permalink |  | Top
 
happyslug Donating Member (1000+ posts) Send PM | Profile | Ignore Wed Jun-22-11 07:11 PM
Response to Original message
9. A couple complications when it comes to sea level rise
Edited on Wed Jun-22-11 07:18 PM by happyslug
First, In areas where the Glacial of the last ice age existed, those areas were depressed by the weight of the ice over them, such areas are still rounding upward, when sea levels were first measured, it appeared that sea levels were dropping till it was determined that instead the land was raising. Given that such data was first collected in Europe, which in Northern Europe is still rebounding from the last ice age, this error had more effect then if such data had been collected from a wider part of the world.

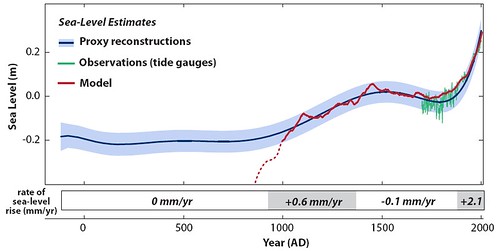
Satellite measuring of the sea level became possible only in the 1970s, thus real good data as to sea level rise is basically only 30 years old (Roughly 1980-2010 and mostly 1990 till present), thus anyone who claims sea level rise before 1980 has to double check the data to make sure something else is causing the local sea level to go up in relation to whatever is being used to measure the rise. Most specialists have done this and have found most of the world has been stable over the last several centuries. One measure has indicated that it has been a mere measure of less then a couple of inches over the last few centuries, and most of that has to do with the increasing temperature of the water more then loss of fresh water from Glaciers.

The big challenge is the three ground base ice sheets, Greenland (Just under 10% of world wide fresh water), The West Antarctic Ice Sheet (Just above 10% of total fresh water) and the East Antarctic Ice Sheet, about 70% of total Fresh water. Rivers, Lakes, and other glaciers make up the remaining 9 to 10% of all fresh water in the world. Given these numbers the retreat of the various glaciers throughout the world, have had only a marginal affect on world wide sea levels. These three ice sheets are big danger.

Now, you will notice I did NOT mention the Arctic Ocean. The reason for that is that the Arctic Ocean is NOT a Ice Sheet (Which by definition is grounded on land), but ice sheets (Which by definition, float atop of ocean waters). Since Ice Sheets float, when they melt, the ice turns to water, but given the Ice in the Ice Shelf is presently displacing same amount of water that makes up the Ice Shelf, you have no net increase in sea levels. Thus if the Arctic would melt today, sea levels would remain the same.

Now, the concern with the Arctic Ice Shelves, is that once the Ice Shelves are gone, it exposes the Greenland Ice Sheet to warmer water, leading it to melt and since it is grounded ABOVE sea level, any water would flow off Greenland and into the Atlantic rising world wide sea levels 15-20 feet over the time period it would melt (Present Guess about 100 years).

The big fear is the West Antarctic Ice Sheet. It is grounded BELOW sea level, so it would quickly be affected by warmer waters once the surrounding Ice Shelves are gone. Worse it is possible that the West Antarctic Ice Sheet is unstable that it could break up within DAYS (i.e. some Day in March or Early April, when the West Antarctic Ice shelves are at its smallest extent, enough heat gets to the Glaciers to cause them all to brake from their base and float. The results would raise world wide sea level 15-20 feet as the ice Sheets becomes floating Ice Shelves and displace sea water of the same volume as in the new ice Shelves (Ice Sheets, being grounded on land but below sea level, displace minimal amount of sea water given most of their ice is way above sea level, but if it breaks up and starts to float, it will displace enough sea water to raise world wide sea levels 15-20 feet).

Now 70% of world wide fresh water is in the East Antarctic Ice Sheet. Unlike the West Antarctic Ice Sheet, which is grounded below sea level, the East Antarctic Ice Sheet is grounded ABOVE sea level, on what is considered the tallest Continent in the world. Yes, South America has the Andes, but it also has the huge low lands of Brazil and Argentina Asia has the Himalayas, but that is offset by the huge flat lands of most if India, Siberia and the flat lands of the Former Soviet Central Asiatic Republics (Chins is mostly rolling hills, thus mid way between the two extremism).

The East Antarctic Ice Sheet is thus on the tallest overall Continent, but is also entirely within the Antarctic Circle. In some of the Global Warming models, it actually increase in ice content during the early years of Global Warming for the following two reasons" First the East Antarctic Ice Sheet sheds very little ice on its edge compared to the other two Ice Sheets given its location and height AND Second computer models show that as air warms, the warmer air can carry more moisture, the warmer air thus carry more moisture over the East Antarctic Ice Sheet, making it higher in ice content.

These two factors should keep the East Antarctic Ice Sheet more or less intact till about 2050 if not later. Global Warming will sooner or later affect even the East Antarctic Ice Sheet but long after every other glacier and ice sheet is long gone.

in short the Greenland Ice Sheet promises to be the first to melt, part of it is below the arctic Circle so quicker to be affected by Global Warming. The West Antarctic Ice Sheet would be the second affected, but the one that would cause the most damage quickly. 15-20 feet increase in sea level over a 50-100 year period, we can handle, but a 15-20 day increase within a couple of days would shut down world trade and force millions of people world wide out of their homes.

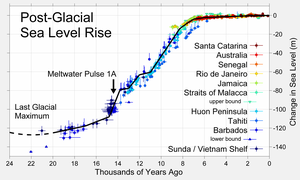
One last comment, just before the last Ice Age started (About 120,000 years ago), something cause world wide sea level to raise 20 feet (We can tell by growth in various reefs at that time period) but within 100 years (Some indication within 80 years) sea levels had dropped 50 feet and the Ice Age was on. The only thing that could have done such a rapid increase would be the West Antarctic Ice Sheet collapsing and by that action released a huge amount of material into the South Pacific and Indian Ocean "Deserts" (Today and for the history we know of these "Deserts" have had no algae do to a lack of iron and various other needed minerals needed for life never reaching those areas). This release of Iron and other minerals turned these Ocean Deserts into super algae colonies, pulling enough CO2 from the atmosphere to cause an Ice Age (Which saw the West Antarctic Ice Sheet to be re-formed and later the other ice sheets, including the North American Ice Sheet that dissolved about 10,000 years ago). This is referred to as the Madhouse Century concept.

More on the Madhouse Century concept:
http://www.imaja.com/as/environment/can/journal/madhousecentury.html

The problem is that we have NOT seen any real increase in world wide Sea Levels, but when it hits, it can hit fast and hard. What will the US do if Manhattan island outside of its center middle third and Harlem, is under water? That would be the case if ocean levels raised 15-20 feet.


Here is a world wide Map Program that shows you what is flooded at various increase in sea levels. Please note the measurements is in meters, 15-20 feet is about 6-7 meters, so the 7 meter that is the default is about right for the West Antarctic Ice Sheet collapse.

http://flood.firetree.net/
Printer Friendly | Permalink |  | Top
 
The Croquist Donating Member (1000+ posts) Send PM | Profile | Ignore Wed Jun-22-11 08:47 PM
Response to Reply #9
11. Present Guess about 100 years?
Now, the concern with the Arctic Ice Shelves, is that once the Ice Shelves are gone, it exposes the Greenland Ice Sheet to warmer water, leading it to melt and since it is grounded ABOVE sea level, any water would flow off Greenland and into the Atlantic rising world wide sea levels 15-20 feet over the time period it would melt (Present Guess about 100 years).

Sorry but I don't buy that. The IPCC is predicting a sea level rise between 7 and 23 inches by 2100 (93 years). You are talking about 180 - 240 inches in 100 years. That is a difference of between 783% and 3,429%.

The current rate is about 3 mm per year or 11 inches by 2100.


Printer Friendly | Permalink |  | Top
 
happyslug Donating Member (1000+ posts) Send PM | Profile | Ignore Wed Jun-22-11 09:47 PM
Response to Reply #11
13. I am talking worse case scenrios, and that is the West Antarctic Ice Sheet
ICPP estimates is based on NO MAJOR CATASTROPHES, i.e. slow melt down only. The Collapse of the West Antarctic Ice Sheet would be a Catastrophe of biblical proportions. 20 feet or 240 inches or 6026 mm would be a one time surge, maybe next spring, the following spring or even 100 years from now. The West Antarctic Ice Sheet has been called the Godzilla of Global Warming. If it goes world wide disaster follows. no one takes that into consideration, but it appears to have happened in the past and some evidence that it may have happened more then once.

As to Greenland, I am citing the worse case Scenario, which exceeds ICPP estimates for ICPP assumes lineral increase in water levels, while other expect it to be geometric (i.e. ICPP expects 1 mm per year for example if we assume 1 mm a year, that provides a rise of 100mm in 100 years, but if the increase is geometric, 1mm in 2010, followed by 2 mm in 2011, followed by 4 mm in 2012 until it hits a maximum number then starts to go down). In Simple term the alternative theory is slow start, then rapid increase, then peak, then slow decline, which is what appears to be happening in Greenland and the Arctic.

Please note the numbers I gave in the previous paragraph was for comparison purposes only, the actual rate of sea level raise is expected to be a lot lower then 1mm, at first.

As a general rule, statisticians (Which I am NOT) have developed over the last few centuries error rates and the concept of "Confidence". "Confidence" is that statement that a difference between two numbers is more then statitiscal error (i.e. something real, not the product of chance). What the statisticians have found that in many situations the square root of an average can give you different level of confidence (The actual formula is much more complex, but I am simplifying it, someone who has taken a Statistic Class some time in the last 30 years would be more familiar them I am at the present time).

Anyway, to have a 90% confidence that 93 years is a real difference from 100 years, lets take the Square Root of 100, 10 (This is called one standard deviation). Thus to have 90% confidence that 100 years is more in reality, not a product of mere chance, of another number, that other number must be less then 90, to have a 95% confidence (or two standard deviations) the other number must be less then 80, to have 99% confidence that the difference between the two numbers is real not the product of mere chance, the other number must be below 70.

Now, I have faith that the scientists who did the actual calculations were able to reduce the standard deviation to something below 10, but I can NOT see them getting a 99% confidence level below 10, thus 93 years or 100 years may be more the product of statistical error then any real difference.

Thus, many people expect both the Greenland Ice Sheet and the West Antarctic Ice Sheet to be gone within 100 years, the same people expect the much larger East Antarctic Ice Sheet to last for a couple of Centuries.

Here is a Cite that cites both the ICPP and "but many researchers believe the rise will be greater because of dynamic factors in ice sheets that appear to have accelerated the melting rate in recent years.":
http://www2.ucar.edu/news/852/melting-greenland-ice-sheets-may-threaten-northeast-united-states-canada

Another Cite saying that Greenland is melting faster then expected:
http://www.spiegel.de/international/world/0,1518,661192,00.html

Report of accelerating loss of ice in Greenland and Antarctica:
http://news.sky.com/skynews/Home/World-News/British-Rsearch-Team-Discovers-Greenland-Ice-Caps-Are-Melting-At-An-Accelerated-Rate/Article/201007415674119
http://www.skepticalscience.com/an-overview-of-greenland-ice-trends.html


Printer Friendly | Permalink |  | Top
 
The Croquist Donating Member (1000+ posts) Send PM | Profile | Ignore Wed Jun-22-11 11:53 PM
Response to Reply #13
15. Worse case scenario
In a worst case scenario we're all dead from any of a dozen disasters from a nearby supernova to a super volcano. The melting of Greenland or West Antarctica is just not likely in thousands of years and the very concept of them suddenly sliding into the ocean is simply not worth worrying about.

MAJOR CATASTROPHES are simply not likely to happen and I will not advocate for them. Reducing CO2 emissions to the levels of 1800 will kill hundreds of millions of people, probably billions and result in one or more nuclear wars. What do you think that a starving India, China or Pakistan will do when faced with famine?

Sea level is up 130 meters in 22,000 years (some people say 120 meters in 20,000 years) and mankind survived. The fact that we built skyscrapers in Manhattan is unimportant to nature. I grew up on Long Island NY. 21,000 years ago it was formed when the glaciers stopped moving south and began to melt. It was formed of the rocks & soil that they pushed ahead of them. 21,000 years ago sea level was much lower and it must have been much larger and attached to the mainland. Nature didn't care.

There are tremendous differences in estimates of sea level rise. Not the current sea level rise, the satellites pretty much have that covered but projected sea level rise. I'm sticking to what we see today not what we might see in the future. I'm a big fan of data.

By the way did you know that 90% of the weather stations measuring temperature in the Continental US fail to meet minimum standards? Apparently climatologists don't care.
Printer Friendly | Permalink |  | Top
 
beardown Donating Member (193 posts) Send PM | Profile | Ignore Thu Jun-23-11 10:38 AM
Response to Reply #15
17. Whiplash award winner for June.
Congrats. I don't read very many 10 scores around here in the debating gymnastics competition.

Sentence one (nice touch on the caps, this is what pushed you from a 9 to the rare 10 score) "MAJOR CATASTROPHES are simply not likely to happen and I will not advocate for them." and then your VERY NEXT sentence (sorry, couldn't resist the caps thing) states "Reducing CO2 emissions to the levels of 1800 will kill hundreds of millions of people, probably billions and result in one or more nuclear wars.".

I'm not the climate scientist that you obviously think that you are, but I'd say killing billions and "one or MORE nuclear wars" (sorry, not an exact quote, but I just loved your caps thing) are all major catastrophes. One minor quibble. Do you really think that we'd be able to have more than one nuclear war?

Carry on.

Printer Friendly | Permalink |  | Top
 
The Croquist Donating Member (1000+ posts) Send PM | Profile | Ignore Thu Jun-23-11 12:33 PM
Response to Reply #17
19. My "MAJOR CATASTROPHES" was a quote from happyslug (in caps) who I was replying to.
Sorry but I should have put it in quotations. happyslug talked about the collapse of the West Antarctic ice sheet. He also discussed the melting of the Greenland ice sheet within 100 years. Those were the "MAJOR CATASTROPHES" I was talking about. They are in posts #'s 9, 11, 13 and 15.

My logic behind "Reducing CO2 emissions to the levels of 1800 will kill hundreds of millions of people, probably billions and result in one or more nuclear wars." is because the world simply can not support over 6 billion people in food let alone in any kind of medical care. The population of the world in 1800 was about 900 million. From memory, I think about 90% of US citizens were farmers in 1900. Do you really think that we can support 300 plus million people in the US today without fossil fuels for fertilizers, tractors, harvesters, trucks (to move the food), refrigeration and pesticides? The US is the worlds largest food exporter. If we can't feed ourselves, lots of other countries will be going hungry. When 90% of US citizens are migrating to farmland they will have no housing, medicine, clothing or food. Ugliness is bound to break out.

Now lets talk about China or India. They will be worse off. Any place they think they can get food they will attack. Russia may not appreciate China invading.

You might as well just write off the horn of Africa. Without food imports (and the last I looked we're short on sailing vessels) they will be dying by the tens of thousands a day. Desperate people do desperate things.

I don't claim to be a climate scientist. I am a retired banker but I am a geek and a number cruncher. I look at data and the quality of the data. I did allot of data work doing projects. Sometimes the data sucked but you dealt with it. If it sucked you had to realize that it sucked and planned accordingly. The climate data sucks. Climate scientists seem to be in denial regarding that. When 90% of current USHCN sites fail minimum standards that means the data sucks. To make matters worse nobody bothered to monitor the quality until a few years ago and then it was only done by "skeptics". You can ignore their findings because of who they are but the problem is that they have documentation. We know that the current data sucks. What we don't know is what the quality was like 20, 50, 100 or 130 years ago. We still don't know what the quality of the data is around the world let alone what it was like 130 years ago. None of this means that the earth isn't warming or that man isn't responsible. What it means is that we don't really know.

Yes we can have more then one nuclear war.
Printer Friendly | Permalink |  | Top
 
beardown Donating Member (193 posts) Send PM | Profile | Ignore Thu Jun-23-11 01:21 PM
Response to Reply #19
21. I see your point, but don't think you get mine.
You disregard other catastrophes, but rely on other ones to make your case. Interesting points (which I agree with) on food production relying on oil to keep up with pop growth, but even a small climate change will have magnified impacts on food production. It's your food wars on steroids. Once again, it's the rate of change that is key and the faster the climate change the faster it will accelerate the food production problems. A self fulfilling prophecy.

Ironically, moving away from mass production agriculture to more labor intensive and less oil dependent agriculture would help. Sacrifices will have to be made, but they would be more evenly distributed. As it is now, I seriously think that the rich have decided to steal as many resources as they can, obstruct any meaningful response that would require them to make sacrifices, circle the wagons, and wait out the big die off.

Per the nuke war(s), as much as I rely on bankers' wisdom, I'll go with Einstein and his "I know not with what weapons World War III will be fought, but World War IV will be fought with sticks and stones." :)
Printer Friendly | Permalink |  | Top
 
The Croquist Donating Member (1000+ posts) Send PM | Profile | Ignore Thu Jun-23-11 03:02 PM
Response to Reply #21
23. Sorry I had a "great" response mostly written but it died in cyber space
I don't think we're seeing anything unusual. The difference is that we are paying attention more then we used to.

Moving away from mass production of food would kill hundreds of millions of people starting with the young and the old.

I also don't think that the rich want to see mass deaths and devastation. The poor in the US today are vastly better off then George Washington was and he was rich. The poor have plumbing. Washington did not. The poor have TV, DVD's, cars, air conditioning, food stamps and central heat. Washington did not. Washington ate bread made from wheat that was trampled on by horses that crapped on it. I don't think that today's rich want to go back to 1799.

Printer Friendly | Permalink |  | Top
 
beardown Donating Member (193 posts) Send PM | Profile | Ignore Thu Jun-23-11 03:52 PM
Response to Reply #23
27. Ouch, the talking point about how great our poor have it.
Using the availability of modern developments to try and downplay poverty and extreme wealth distribution is a common right wing tactic. By the same token, the rich should not mind paying 99 percent of their income as taxes as long as they can keep two cows, a flock of sheep, and a barn full of hay. After all, that's more than a rich cave man had.

It's not that the rich want the mass deaths and going back to 1799. First off, they aren't going back to 1799. They have decided the mass deaths are a fair trade off so that a small group of rich folks can keep living a modern lifestyle while the unwashed masses suffer the great die off. And part of this is to put large amounts of resources into denying things like climate change and thus delaying any governmental action that would spread the sacrifice.

Using more labor and less oil to produce food would not bring mass starvation. It would make food more expensive and have more food consumed locally. It would be complimented with alternate energy and sustainable farming methods. Not barbaric at all. The scary part is that food production would be more distributed and localized and thus harder to monopolize and control by the ultra-rich.

And I don't think that the bugs and plants and diseases that are moving into new zones as climate changes occur are doing so because we are paying more attention than we used to. I don't think that the CO2 levels are rising because we are paying more attention. Now people linking every weather event to climate change is partly due to the increased attention, but that's more than fair as every damn time it's cold in Chicago or Buffalo I have to read some rightee saying that it invalidates global warming.


Printer Friendly | Permalink |  | Top
 
The Croquist Donating Member (1000+ posts) Send PM | Profile | Ignore Thu Jun-23-11 06:22 PM
Response to Reply #27
34. You're missing the point
I posted earlier that if we cut human CO2 emissions down to 1800 levels it would result in hundreds of millions if not billions of lives, Simply put the world can not support 6 plus billion people without fossil fuels.

Using more labor and less oil to produce food would not bring mass starvation. It would make food more expensive and have more food consumed locally. It would be complimented with alternate energy and sustainable farming methods. Not barbaric at all. The scary part is that food production would be more distributed and localized and thus harder to monopolize and control by the ultra-rich.

The world's largest food exporter is the United States. By definition that food is not consumed locally. Large parts of Africa and Asia can't feed themselves. That's not because the ultra-rich won't let them. It's because there are too many of them for the land to support.

And I don't think that the bugs and plants and diseases that are moving into new zones as climate changes occur are doing so because we are paying more attention than we used to.

Actually I partially agree with you but sometimes they move for other reasons. I think it was the "Tiger Mosquito" that established itself in Italy maybe ten years ago. It was blamed on Global warming. In it's lifetime it travels something like 200 yards. Sri Lanka is 5 - 10 thousand miles from Italy. You don't think it was the cargo ships going through the Suez Canal do you?

We've got Kudzu in the south. We've got African Bees in the south. We've got Fire ants in the south. All of them we're introduced into the new world. We've got Mediterranean Fruit Flies in the US. Do you think they flew here?

International commerce brings pests a long way from home. The US had huge malaria problems in the 1800's. Now not so much. Why is that? Is it because it got too cold or because we eliminated the pest? By the way, without income we won't be able to eliminate the pests.

I don't think that the CO2 levels are rising because we are paying more attention. Now people linking every weather event to climate change is partly due to the increased attention, but that's more than fair as every damn time it's cold in Chicago or Buffalo I have to read some rightee saying that it invalidates global warming.

People on the "skeptic" side seize on a cold spell to "prove" their point but people on he "believer" side claim that cold is caused by global warming. Droughts and floods are caused by global warming. Heat is caused by global warming. Hurricanes and tornadoes are caused by global warming. There are more absurd claims but I'll spare you.

By the way, don't accuse someone who questions global warming to be a rightee. That's rude.


Printer Friendly | Permalink |  | Top
 
truebrit71 Donating Member (1000+ posts) Send PM | Profile | Ignore Thu Jun-23-11 04:10 PM
Response to Reply #15
28. Wait, what? "the melting of Greenland or West Antarctica is just not likely in thousands of years"?
Edited on Thu Jun-23-11 04:17 PM by truebrit71
say WHAT???

It's happening NOW...never mind "thousands of years from now" or even "in 100 years time", they are melting, at a faster rate than previously thought, RIGHT FUCKING NOW.

India, China and Pakistan will have to deal with starvation if we DON'T reduce carbon because their farmland will be underwater...

http://www.sciencedaily.com/releases/2011/01/110121144011.htm
http://www.spiegel.de/international/world/0,1518,661192,00.html

You're not just barking up the wrong tree, you aren't even in the right forest...

Printer Friendly | Permalink |  | Top
 
The Croquist Donating Member (1000+ posts) Send PM | Profile | Ignore Fri Jun-24-11 07:41 AM
Response to Reply #28
35. If Greenland is melting faster then ever, where is the water going?
http://sealevel.colorado.edu/files/current/sl_ib_global.txt

Sea level reached it's peak on 11/5/2009 and has since dropped by 24 mm. Short term trends mean nothing but you are quoting a study looking at a short term trend. They are still finding trees and Viking farms buried in ice. Obviously it had less ice on it 700 years ago then today. Ask yourself why? It certainly was not caused by man. Now we are told that something similar has to be caused by man. What is different today then 700 years ago?

I just pulled up the temperatures for Nuuk (Godthab) Greenland. I choose Nuuk because it was cited in one of your links. The average high for May 2011 was 35.71 F. The average low was 28.84 F. The historical high and low are 38 F and 29 F respectively.

http://www.weather.com/weather/monthly/GLXX0003?month=-1

It's a bit time consuming so I only did the most recent complete month. It looks like temperatures there are about normal. A couple of degrees off in not unusual.
Printer Friendly | Permalink |  | Top
 
OnlinePoker Donating Member (837 posts) Send PM | Profile | Ignore Fri Jun-24-11 08:34 AM
Response to Reply #35
38. Here's a site that shows global temp anomalies animated for the last 30 days
Printer Friendly | Permalink |  | Top
 
The Croquist Donating Member (1000+ posts) Send PM | Profile | Ignore Fri Jun-24-11 09:55 AM
Response to Reply #38
40. Data Web Sites
UAH Satellite Temperature Data:
http://vortex.nsstc.uah.edu/public/msu/t2lt/tltglhmam_5.4
RSS Satellite Temperature Data:
ftp://ftp.ssmi.com/msu/monthly_time_series/rss_monthly_msu_amsu_channel_tlt_anomalies_land_and_ocean_v03_2.txt
Monthly NSIDC Sea Ice Data:
http://nsidc.org/cgi-bin/bist/bist.pl?annot=1&legend=1&scale=100&tab_cols=1&tab_rows=3&config=seaice_index&submit=Refresh&mo0=04&hemis0=N&img0=extn&year0=2011&year1=2010&year2=2009
Daily Sea Ice Data:
http://www.ijis.iarc.uaf.edu/en/home/seaice_extent.htm
GISS Surface Station Data:
http://data.giss.nasa.gov/gistemp/maps/
Colorado University Sea Level Data:
http://sealevel.colorado.edu/files/current/sl_ib_global.txt
Skeptical site Auditing the USHCN Surface stations:
http://gallery.surfacestations.org/main.php?g2_itemId=20

The one closest to my home is Covington GA:
http://gallery.surfacestations.org/main.php?g2_itemId=1914
It ranks as a 4 on the CRN rating system. 64% of stations fall in this category and is considered to have an error rate of greater then 2 degrees C. Why don't you take a look at the nearest one to you?
Printer Friendly | Permalink |  | Top
 
guardian Donating Member (1000+ posts) Send PM | Profile | Ignore Thu Jun-23-11 04:26 PM
Response to Original message
29. Q: Why stop at 2000 years?
A: Because selectively playing with the scale and period results in a misleading doomer conclusion.


Notice how using a longer time scale completely deflates the doomer fear mongering.
Printer Friendly | Permalink |  | Top
 
The Croquist Donating Member (1000+ posts) Send PM | Profile | Ignore Fri Jun-24-11 08:10 AM
Response to Reply #29
37. In general I disagree
The study itself is flawed and questionable but they could have extended it by thousands of years and reached the same conclusion. The problem is a combination of geology and dating. The North Carolina data was taken from a delta zone. Deltas change over time. The further out you go, the less reliable the data gets. Personally I think that 2000 years is too long.
Printer Friendly | Permalink |  | Top
 
guardian Donating Member (1000+ posts) Send PM | Profile | Ignore Fri Jun-24-11 04:26 PM
Response to Reply #37
41. Point taken
I understand that the data are less reliable the further back in time you go. I alluded to this in post#30 of this thread. I also understand that land masses rise and fall; usually slowly but then again Japan reportedly moved 8 feet during the recent earthquake. However, I think in this case it is relevant to look at a longer period because of the magnitude of the change in sea level. So even if the older data have signifcant amount of error, the magnitude delta overshadows the alarmist claims about the current rate.

According to the graphs below, the sea level was about 120 meters lower than present level. The global warming adherents are fighting over measly centimeters. Essentially my point is that if in recent history (since the last ice age) the rate of change in sea level increase was much much greater than present day, and much much greater than the models predict, how or why is this something to be alarmed about?


Based on the above graphs the rate of change appears to have slowed dramatically. Exactly the opposite of what the doomers claim. I'm just not going to get all worked up over an up or down change of a few centimeters in the last or next several decades--not when the change represents 0.001 of the total change in recent times.
Printer Friendly | Permalink |  | Top
 
DU AdBot (1000+ posts) Click to send private message to this author Click to view 
this author's profile Click to add 
this author to your buddy list Click to add 
this author to your Ignore list Thu May 02nd 2024, 09:37 PM
Response to Original message
Advertisements [?]
 Top

Home » Discuss » Topic Forums » Environment/Energy Donate to DU

Powered by DCForum+ Version 1.1 Copyright 1997-2002 DCScripts.com
Software has been extensively modified by the DU administrators


Important Notices: By participating on this discussion board, visitors agree to abide by the rules outlined on our Rules page. Messages posted on the Democratic Underground Discussion Forums are the opinions of the individuals who post them, and do not necessarily represent the opinions of Democratic Underground, LLC.

Home  |  Discussion Forums  |  Journals |  Store  |  Donate

About DU  |  Contact Us  |  Privacy Policy

Got a message for Democratic Underground? Click here to send us a message.

© 2001 - 2011 Democratic Underground, LLC