Democratic Underground Latest Greatest Lobby Journals Search Options Help Login
Google

Oil prices and Food prices

Printer-friendly format Printer-friendly format
Printer-friendly format Email this thread to a friend
Printer-friendly format Bookmark this thread
This topic is archived.
Home » Discuss » Topic Forums » Environment/Energy Donate to DU
 
GliderGuider Donating Member (1000+ posts) Send PM | Profile | Ignore Thu Nov-18-10 12:29 PM
Original message
Oil prices and Food prices
Edited on Thu Nov-18-10 12:30 PM by GliderGuider
Just for grins, I took the monthly world Food Price Index from the FAO and the monthly average oil price from the EIA, and plotted them together.


Well, well, well. So when a combination of global economic recovery and oil supply constraints begins to squeeze oil prices up back in the near future, what do we think might happen to food prices???

Economic recovery might be the worst thing imaginable for the people in poor nations.
Printer Friendly | Permalink |  | Top
dkf Donating Member (1000+ posts) Send PM | Profile | Ignore Thu Nov-18-10 12:32 PM
Response to Original message
1. Poor nations like the US?
We've already got a considerable number of people going hungry. Yet we see how food producers exploit workers. It's a dilemma.
Printer Friendly | Permalink |  | Top
 
guardian Donating Member (1000+ posts) Send PM | Profile | Ignore Thu Nov-18-10 12:43 PM
Response to Original message
2. Makes sense
I don't think I've ever seen these two factors compared like this before, but it makes sense. I'm guessing some significant percentage of food cost is tied to oil prices. Tractors are used to till, plant, and harvest food. Trucks are used to transport food. There is probably a similar correlation with most products. Especially with transportation.

I remember how our food costs doubled back when gas was $4/gallon. As gas prices creep back up I expect food will continue to cost more. Unfortunately this hurts the poor most; as food represents a larger part of their budget. This was an unfortunate side effect of the putting ethanol in gasoline. It drove up food prices and the poorest around the world starved as they couldn't afford the increase in grain prices.

Printer Friendly | Permalink |  | Top
 
DCKit Donating Member (1000+ posts) Send PM | Profile | Ignore Thu Nov-18-10 01:10 PM
Response to Original message
3. Nicely done. n/t
Printer Friendly | Permalink |  | Top
 
Fledermaus Donating Member (1000+ posts) Send PM | Profile | Ignore Thu Nov-18-10 01:55 PM
Response to Original message
4. Prices for food commodities still lagging others
Printer Friendly | Permalink |  | Top
 
GliderGuider Donating Member (1000+ posts) Send PM | Profile | Ignore Thu Nov-18-10 02:08 PM
Response to Reply #4
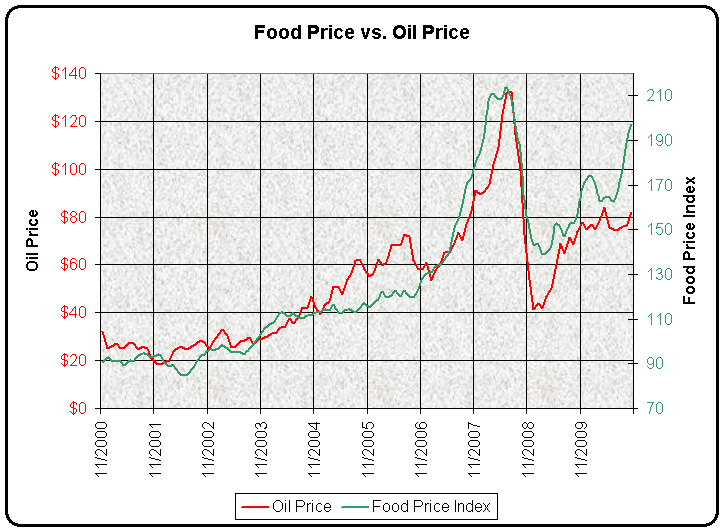
5. Interesting. My graph shows them leading oil prices.
Not sure why that might be.
Printer Friendly | Permalink |  | Top
 
Nihil Donating Member (1000+ posts) Send PM | Profile | Ignore Thu Nov-18-10 07:02 PM
Response to Reply #5
7. Not sure I agree with you ...
> Interesting. My graph shows them leading oil prices.
> Not sure why that might be.

To me it looks more like food *lagging* oil by about a year
at first, the gap closing during 2004/2005 until all hell
breaks loose in 2006 and food overtakes oil to lead ...


My guess at that is that 2006 is when the derivative traders really
cut deep and screwed the normal supply/demand state of play.
Rather than the price of oil affecting food prices directly (taking
the added cost of transport/production and causing increased prices)
the food prices started to jump in anticipation of an oil price rise,
trying to maximise profit across the board (especially the board of
directors in casino Wall St. companies).

Reminds me of a popular phrase during the "methodology wars": "JIT ~= OFWO"

("Just In Time" is very close to "Oh Fuck We're Out")

:evilgrin:
Printer Friendly | Permalink |  | Top
 
GliderGuider Donating Member (1000+ posts) Send PM | Profile | Ignore Thu Nov-18-10 07:08 PM
Response to Reply #7
8. That's an interesting take on it.
I'm constitutionally disinclined to think that traders have that kind of influence in global markets, and the FAO's FPI is an aggregation of multiple markets as I understand it. But it does look like there was a shift in 2006. I'll think about it. Thanks for pointing that out.
Printer Friendly | Permalink |  | Top
 
Fledermaus Donating Member (1000+ posts) Send PM | Profile | Ignore Thu Nov-18-10 07:21 PM
Response to Reply #7
9. n/t
Edited on Thu Nov-18-10 07:22 PM by Fledermaus
Printer Friendly | Permalink |  | Top
 
Fledermaus Donating Member (1000+ posts) Send PM | Profile | Ignore Thu Nov-18-10 07:23 PM
Response to Reply #5
10. your graph is BS and bad science
If you want to make something based on reality then you should compare two indexes.
Printer Friendly | Permalink |  | Top
 
GliderGuider Donating Member (1000+ posts) Send PM | Profile | Ignore Thu Nov-18-10 09:25 PM
Response to Reply #10
11. Oh, get off your high horse. I'm not doing "science", I'm posting stuff on the Internet.
I graphed two sets of numbers and got a very suggestive correlation. It will be interesting to follow the evolution of the data over time and see if the situation holds, but there's no "science" involved. This is purely one of those things you see on the internet from time to time that makes you say "Hmmm."
Printer Friendly | Permalink |  | Top
 
Fledermaus Donating Member (1000+ posts) Send PM | Profile | Ignore Fri Nov-19-10 12:26 PM
Response to Reply #11
12. You're a fear monger peddling BS
Edited on Fri Nov-19-10 12:40 PM by Fledermaus

Groucho Marx - "take a letter Jameson"
http://www.youtube.com/watch?v=-J6OEEbZ9Ko&NR=1
Printer Friendly | Permalink |  | Top
 
Terry in Austin Donating Member (1000+ posts) Send PM | Profile | Ignore Sun Nov-21-10 10:27 PM
Response to Reply #12
14. Just curious
What is it exactly you're afraid of here?
Printer Friendly | Permalink |  | Top
 
GliderGuider Donating Member (1000+ posts) Send PM | Profile | Ignore Fri Nov-19-10 01:06 PM
Response to Reply #10
13. Maybe you'll like this better, then.
This time I used two indices as you suggested, from IndexMundi.com: the Commodity Food Price Index and the Commodity Fuel Index. I normalized both indices to 100 at Jan. 2006, and plotted the most recent 5 years. I only used a single Y axis to remove the previous scaling distortion between the graphs.


On second thought, you probably won't like it any better. The correlation is still obvious.
Printer Friendly | Permalink |  | Top
 
GliderGuider Donating Member (1000+ posts) Send PM | Profile | Ignore Thu Nov-18-10 02:23 PM
Response to Original message
6. The correlation coefficient of the two data sets is 0.93
Conclusion: rising food prices drive up oil prices.

Just kidding...
Printer Friendly | Permalink |  | Top
 
Terry in Austin Donating Member (1000+ posts) Send PM | Profile | Ignore Sun Nov-21-10 10:28 PM
Response to Reply #6
15. Kinda makes you go "hmmm..."
Love these internets!

:hi:
Printer Friendly | Permalink |  | Top
 
DU AdBot (1000+ posts) Click to send private message to this author Click to view 
this author's profile Click to add 
this author to your buddy list Click to add 
this author to your Ignore list Wed May 01st 2024, 04:39 AM
Response to Original message
Advertisements [?]
 Top

Home » Discuss » Topic Forums » Environment/Energy Donate to DU

Powered by DCForum+ Version 1.1 Copyright 1997-2002 DCScripts.com
Software has been extensively modified by the DU administrators


Important Notices: By participating on this discussion board, visitors agree to abide by the rules outlined on our Rules page. Messages posted on the Democratic Underground Discussion Forums are the opinions of the individuals who post them, and do not necessarily represent the opinions of Democratic Underground, LLC.

Home  |  Discussion Forums  |  Journals |  Store  |  Donate

About DU  |  Contact Us  |  Privacy Policy

Got a message for Democratic Underground? Click here to send us a message.

© 2001 - 2011 Democratic Underground, LLC