| Latest | Greatest | Lobby | Journals | Search | Options | Help | Login |
|
|
|
This topic is archived. |
| Home » Discuss » Topic Forums » Environment/Energy |
|
| Dead_Parrot
|
Sun Aug-15-10 06:59 PM Original message |
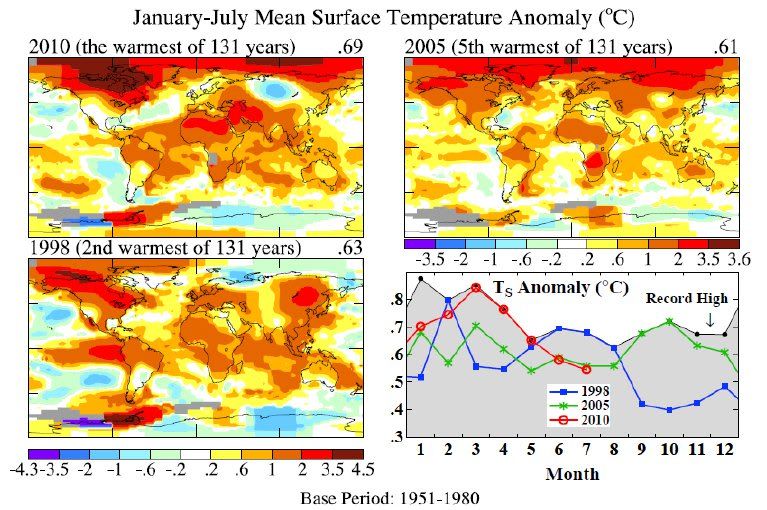
| Hansen: What Global Warming Looks like (So Far) |
| Printer Friendly | Permalink | | Top |
| another saigon
|
Sun Aug-15-10 07:08 PM Response to Original message |
| 1. k&r |
| Printer Friendly | Permalink | | Top |
| msongs
|
Sun Aug-15-10 08:27 PM Response to Original message |
| 2. we are enjoying our cooler than normal summer here in so cal :-) nt |
| Printer Friendly | Permalink | | Top |
| Dead_Parrot
|
Mon Aug-16-10 05:10 PM Response to Reply #2 |
| 4. Technically, it's just not hotter than normal |
| Printer Friendly | Permalink | | Top |
| joshcryer
|
Mon Aug-16-10 04:25 AM Response to Original message |
| 3. Thanks, will make a good read soon. |
| Printer Friendly | Permalink | | Top |
| Nederland
|
Tue Aug-17-10 09:35 AM Response to Original message |
| 5. Funny what he doesn't say |
| Printer Friendly | Permalink | | Top |
| caraher
|
Tue Aug-17-10 09:35 PM Response to Reply #5 |
| 6. Or maybe because that's a sentence from the abstract |
| Printer Friendly | Permalink | | Top |
| joshcryer
|
Tue Aug-17-10 09:49 PM Response to Reply #5 |
| 7. Hansen's original predictions were models. You're chosing the high end estimates. |
| Printer Friendly | Permalink | | Top |
| joshcryer
|
Tue Aug-17-10 09:55 PM Response to Reply #5 |
| 8. Heh, Hansen reports exactly that at the last freaking line of the paper: |
| Printer Friendly | Permalink | | Top |
| Nederland
|
Tue Aug-17-10 10:49 PM Response to Reply #8 |
| 9. Good catch |
| Printer Friendly | Permalink | | Top |
| joshcryer
|
Wed Aug-18-10 08:31 AM Response to Reply #9 |
| 10. "Frozen at 1988 rates" is ambigious or misleading, it was set at the annual growth observed in 1988. |
| Printer Friendly | Permalink | | Top |
| The Croquist
|
Mon Aug-23-10 10:09 AM Response to Reply #10 |
| 12. What 3 super volcanoes? |
| Printer Friendly | Permalink | | Top |
| joshcryer
|
Tue Aug-24-10 04:05 AM Response to Reply #12 |
| 13. In the models they just threw some in there. |
| Printer Friendly | Permalink | | Top |
| The Croquist
|
Tue Aug-24-10 07:33 AM Response to Reply #13 |
| 14. I think we both could have done better |
| Printer Friendly | Permalink | | Top |
| joshcryer
|
Wed Aug-25-10 11:52 AM Response to Reply #14 |
| 15. The methodology for his temperature record is open for anyone to review, just like UAH. |
| Printer Friendly | Permalink | | Top |
| The Croquist
|
Thu Aug-26-10 06:41 AM Response to Reply #15 |
| 16. Anyone with an .edu account can get for free |
| Printer Friendly | Permalink | | Top |
| joshcryer
|
Sat Aug-21-10 11:50 AM Response to Original message |
| 11. Kick. |
| Printer Friendly | Permalink | | Top |
| DU
AdBot (1000+ posts) |
Thu May 02nd 2024, 12:35 AM Response to Original message |
| Advertisements [?] |
| Top |
| Home » Discuss » Topic Forums » Environment/Energy |
|
Powered by DCForum+ Version 1.1 Copyright 1997-2002 DCScripts.com
Software has been extensively modified by the DU administrators
Important Notices: By participating on this discussion board, visitors agree to abide by the rules outlined on our Rules page. Messages posted on the Democratic Underground Discussion Forums are the opinions of the individuals who post them, and do not necessarily represent the opinions of Democratic Underground, LLC.
Home | Discussion Forums | Journals | Store | Donate
About DU | Contact Us | Privacy Policy
Got a message for Democratic Underground? Click here to send us a message.
© 2001 - 2011 Democratic Underground, LLC