The Elusive California Housing Bottom: The Relationship between Unemployment and Housing Prices. Market Conditions point to a 2013 Market Bottom.
On Friday, state unemployment figures highlighted a weak job market. The California numbers moved up again reaching a high for the recession registering an 11.6 percent unemployment rate. This comes at a time when the state is in a $26.3 billion budget deficit. Even though some are getting excited that a budget deal may be in reach, they forget that we still have a revenue problem. What does that mean? Well be back in this same spot a few months down the road. Much of these structural problems have to do with how California collects revenues from personal income taxes and other volatile sources of income. Another reason why this will be a prolonged recession for the state is our heavy reliance on real estate.
I happened to catch one of those house-flipping shows this weekend and what I saw simply reaffirms that California still has pockets of denial. A home was bought in a better area of Southern California and the buyers added every tiny detail including a Jacuzzi, stainless steal appliances, hardwood floors, and of course the granite countertops. The home needed work but was in a so-called prime area. The home sat on the market as you would suspect but eventually, someone paid a price that simply did not justify the home and location. From purchase, rehab, to sale it took nearly one year. The realtors gave out price ranges from $500,000 to $910,000. The asking price was over $1 million. It sold for that price.
This simply reaffirms what I have been observing and what the data is telling us. The middle to upper range of the market is finding fewer and fewer suckers. The Alt-A and option ARM tsunami will hit these areas like a ton of bricks come late 2009 and into 2010. Some of these areas include Culver City, Palms, and Pasadena. But I know the main question many want answered is when will we really see a true bottom for the California housing market? For that answer, I decided to compile an intricate graph looking at tiered housing prices for the Los Angeles area and statewide unemployment:
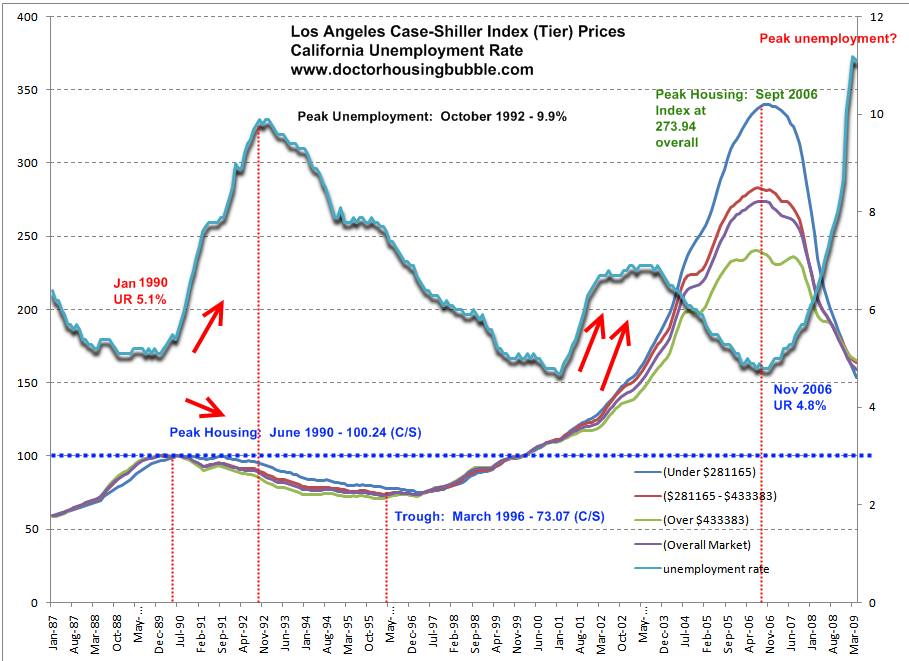
We should spend some time looking at this chart carefully since it may hold the future of where we are heading. First, in the late 1980s to early 1990s Southern California had a housing bubble. Shocking, I know. The peak was reached in June of 1990 looking at the Case-Shiller data. The unemployment rate hit a trough in January of 1990 at 5.1 percent. This is one of your more typical patterns of housing declines. First, you see unemployment creeping up which burst the housing bubble. Housing prices did not reach a trough until March of 1996 nearly six years later. Unemployment peaked in October of 1992 at 9.9 percent. Even as the employment situation improved, housing prices still continued their downward movement.
http://www.doctorhousingbubble.com/the-elusive-california-housing-bottom-the-relationship-between-unemployment-and-housing-prices-market-conditions-point-to-a-2013-market-bottom/