Democratic Underground Latest Greatest Lobby Journals Search Options Help Login
Google

Income inequality growing faster in UK than any other rich country, says OECD

Printer-friendly format Printer-friendly format
Printer-friendly format Email this thread to a friend
Printer-friendly format Bookmark this thread
Home » Discuss » Latest Breaking News Donate to DU
 
Turborama Donating Member (1000+ posts) Send PM | Profile | Ignore Mon Dec-05-11 12:01 PM
Original message
Income inequality growing faster in UK than any other rich country, says OECD
Edited on Mon Dec-05-11 12:15 PM by Turborama
Source: The Guardian

Top 10% have incomes 12 times greater than bottom 10%, up from eight times greater in 1985, thinktank's study reveals

Randeep Ramesh, social affairs editor | Monday December 5 2011 10.39 GMT

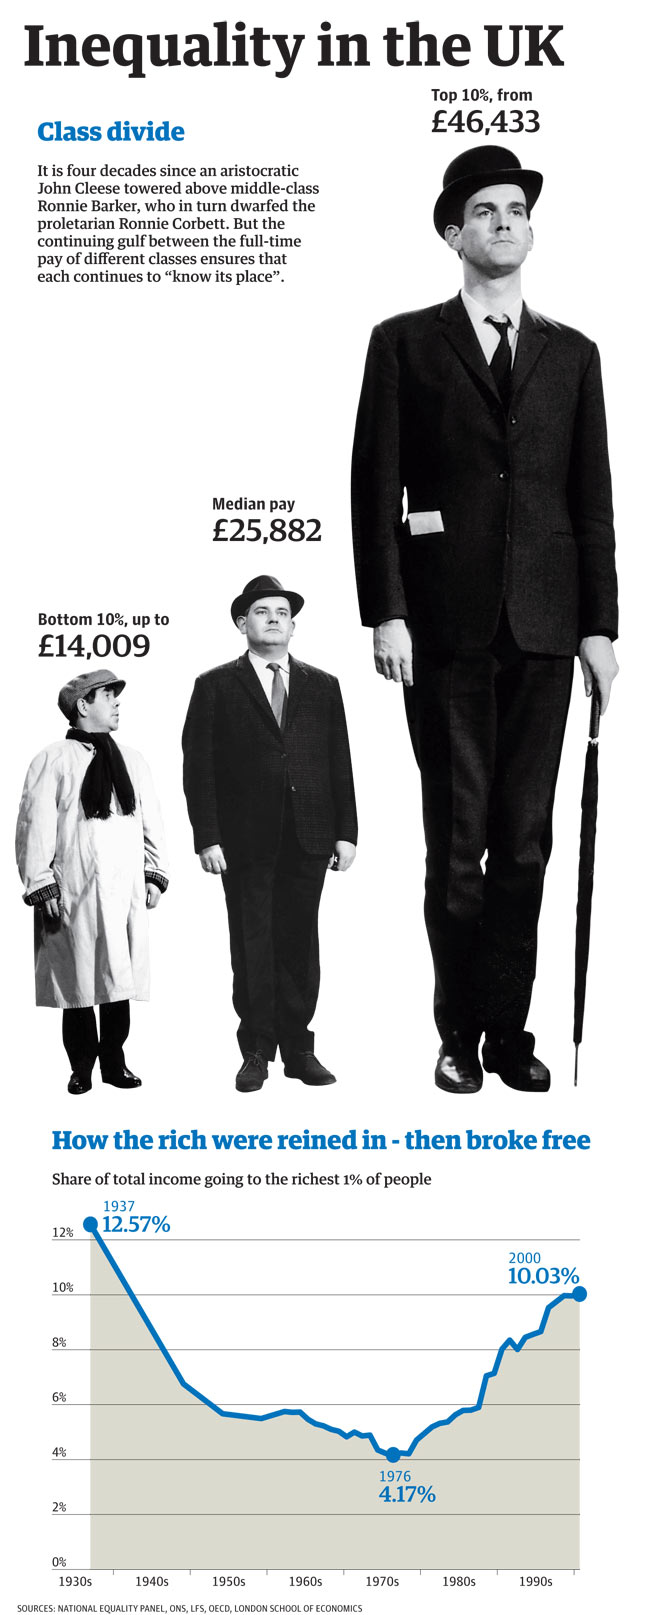
Income inequality among working-age people has risen faster in Britain than in any other rich nation since the mid-1970s owing to the rise of a financial services elite who through education and marriage have concentrated wealth into the hands of a tiny minority, according to a new report by the OECD.

Economists from the thinktank, which is funded by developed world taxpayers, say the annual average income in the UK of the top 10% in 2008 was just under £55,000, about 12 times higher than that of the bottom 10%, who had an average income of £4,700.

This is up from a ratio of eight to one in 1985 and significantly higher than the average income gap in developed nations of nine to one.

However, the report makes clear that even in countries viewed as "fairer" – such as Germany, Denmark and Sweden – this pay gap between rich and poor is expanding: from five to one in the 1980s to six to one today. In the rising powers of Brazil, Russia, India and China the ratio is an alarming 50 to one.

Read more: http://www.guardian.co.uk/society/2011/dec/05/income-inequality-growing-faster-uk


And, of course, the growth of the income inequality gap in the UK will only continue to speed up now the Tories are at the helm relishing imposing their draconian austerity frenzy on the population.

The OECD report also warns about the stratospheric rise of the top 1% in rich societies plus the falling share of income going to poorer people.

More details about the report at the link, and here...

http://www.guardian.co.uk/news/datablog/2011/dec/05/oecd-ineqaulity-report-uk-us">OECD inequality report: how do different countries compare?


Refresh | +12 Recommendations Printer Friendly | Permalink | Reply | Top
xchrom Donating Member (1000+ posts) Send PM | Profile | Ignore Mon Dec-05-11 12:08 PM
Response to Original message
1. Recommend
Printer Friendly | Permalink | Reply | Top
 
LeftishBrit Donating Member (1000+ posts) Send PM | Profile | Ignore Mon Dec-05-11 12:10 PM
Response to Original message
2. Not surprised, sadly.
Printer Friendly | Permalink | Reply | Top
 
Bosonic Donating Member (774 posts) Send PM | Profile | Ignore Mon Dec-05-11 12:17 PM
Response to Original message
3. Another metric (for 2009)
Edited on Mon Dec-05-11 12:21 PM by Bosonic
http://en.wikipedia.org/wiki/Gini_coefficient">Gini-coefficient of national income distribution (a statistical measure of Income inequality). The higher the number, the greater the inequality.


Printer Friendly | Permalink | Reply | Top
 
Turborama Donating Member (1000+ posts) Send PM | Profile | Ignore Mon Dec-05-11 12:24 PM
Response to Reply #3
4. The report based its measurements on the Gini coefficient...
From the second link in the OP (which also has a couple of interactive Gini graphs worth checking out):

The report, which examined earnings in each of the OECD's 34 member countries and took more than two years to complie, based its measurements on the Gini coefficient, where countries are ranked between a figure of zero where everyone earns the same to 1 - where the richest person has all the income.

Thanks for the interesting map. :hi:
Printer Friendly | Permalink | Reply | Top
 
Bosonic Donating Member (774 posts) Send PM | Profile | Ignore Mon Dec-05-11 12:33 PM
Response to Reply #4
5. I must have skipped over the 2nd link
The first didn't reference Gini. Oh well, the map gives a static geographical distribution, but doesn't highlight trends.
Printer Friendly | Permalink | Reply | Top
 
dipsydoodle Donating Member (1000+ posts) Send PM | Profile | Ignore Mon Dec-05-11 12:49 PM
Response to Original message
6. I was earning the figure on top of Cleese head
selling photocopiers in 1987 and I'd hardly refer to myself as top 10%. It was a reflection of effort and nothing else.
Printer Friendly | Permalink | Reply | Top
 
DU AdBot (1000+ posts) Click to send private message to this author Click to view 
this author's profile Click to add 
this author to your buddy list Click to add 
this author to your Ignore list Sun May 05th 2024, 07:38 AM
Response to Original message
Advertisements [?]
 Top

Home » Discuss » Latest Breaking News Donate to DU

Powered by DCForum+ Version 1.1 Copyright 1997-2002 DCScripts.com
Software has been extensively modified by the DU administrators


Important Notices: By participating on this discussion board, visitors agree to abide by the rules outlined on our Rules page. Messages posted on the Democratic Underground Discussion Forums are the opinions of the individuals who post them, and do not necessarily represent the opinions of Democratic Underground, LLC.

Home  |  Discussion Forums  |  Journals |  Store  |  Donate

About DU  |  Contact Us  |  Privacy Policy

Got a message for Democratic Underground? Click here to send us a message.

© 2001 - 2011 Democratic Underground, LLC