OKIsItJustMe
OKIsItJustMe's JournalCNN Opinion: I'm a climate scientist. If you knew what I know, you'd be terrified too
https://www.cnn.com/2024/03/07/opinions/climate-scientist-scare-doom-anxiety-mcguire/index.htmlOpinion by Bill McGuire
4 minute read — Updated 9:56 AM EST, Thu March 7, 2024
Editor’s Note: Editor’s Note: Bill McGuire is professor emeritus of geophysical & climate hazards at University College London and author of “Hothouse Earth: An Inhabitant’s Guide.” The views expressed in this commentary are his own. Read more CNN opinion here.
CNN
—
Are you frightened by climate change? Do you worry about what sort of world we are bequeathing to our children and grandchildren? In the words of science writer and author of “The Uninhabitable Earth” David Wallace-Wells, “No matter how well informed you are, you are surely not alarmed enough.”
I would put it even more strongly.
If the fracturing of our once stable climate doesn’t terrify you, then you don’t fully understand it. The reality is that, as far as we know, and in the natural course of events, our world has never — in its entire history — heated up as rapidly as it is doing now. Nor have greenhouse gas levels in the atmosphere ever seen such a precipitous hike.
…
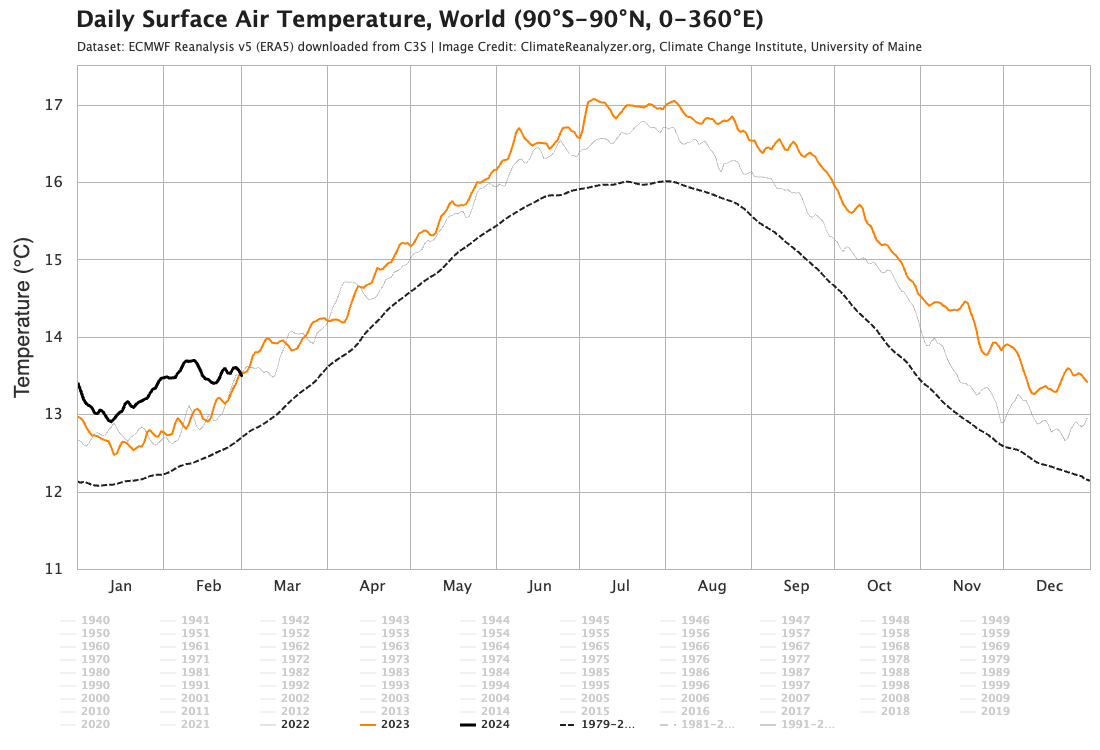
Ninth Record Breaking Month in a Row
https://climatereanalyzer.org/clim/t2_daily/?dm_id=world
And now, with less “spaghetti":
- Dashed line: 1979-2000 Average
- Gray line: 2022
- Orange line: 2023
- Black line: 2024
Projections of an ice-free Arctic Ocean
https://doi.org/10.1038/s43017-023-00515-9Projections of an ice-free Arctic Ocean
Alexandra Jahn, Marika M. Holland & Jennifer E. Kay
Nature Reviews Earth & Environment (2024)
Abstract
Observed Arctic sea ice losses are a sentinel of anthropogenic climate change. These reductions are projected to continue with ongoing warming, ultimately leading to an ice-free Arctic (sea ice area ﹤1?million?km²). In this Review, we synthesize understanding of the timing and regional variability of such an ice-free Arctic. In the September monthly mean, the earliest ice-free conditions (the first single occurrence of an ice-free Arctic) could occur in 2020–2030s under all emission trajectories and are likely to occur by 2050. However, daily September ice-free conditions are expected approximately 4?years earlier on average, with the possibility of preceding monthly metrics by 10?years. Consistently ice-free September conditions (frequent occurrences of an ice-free Arctic) are anticipated by mid-century (by 2035–2067), with emission trajectories determining how often and for how long the Arctic could be ice free. Specifically, there is potential for ice-free conditions in May–January and August–October by 2100 under a high-emission and low-emission scenario, respectively. In all cases, sea ice losses begin in the European Arctic, proceed to the Pacific Arctic and end in the Central Arctic, if becoming ice free at all. Future research must assess the impact of model selection and recalibration on projections, and assess the drivers of internal variability that can cause early ice-free conditions.
…
https://www.democraticunderground.com/?com=view_post&forum=1127&pid=168542
James Hansen et al. Groundhog Day. Another Gobsmackingly Bananas Month. What's Up?
http://www.columbia.edu/~jeh1/mailings/2024/Groundhog.04January2024.pdf
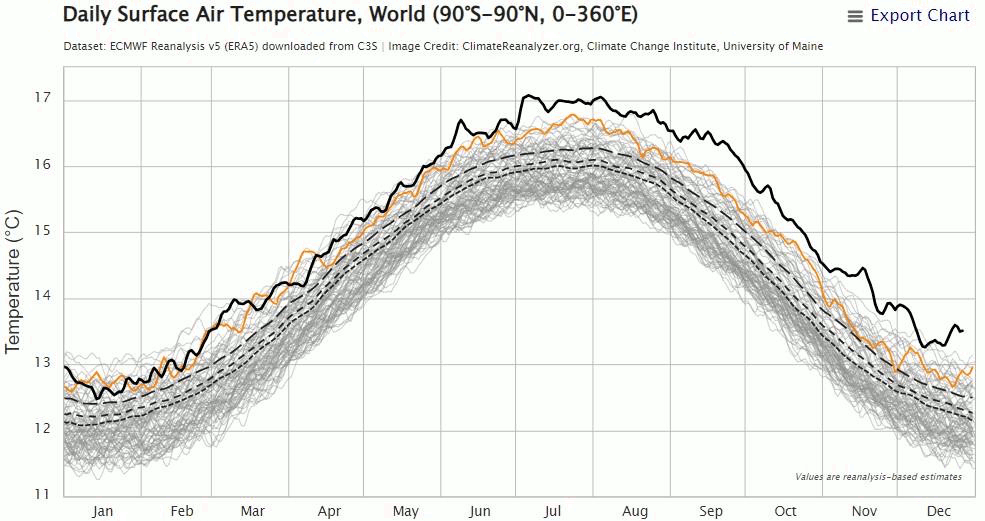
Fig. 1. Daily surface temperature analysis from the ECMWF reanalysis version 5 (ERA5).¹
04 January 2024
James Hansen, Makiko Sato, Pushker Kharecha
Abstract. December was the 7th consecutive month of record-shattering global temperature, driven by the combination of a moderately strong El Nino and a large decrease of Earth’s albedo. The El Nino will fade in the next few months, but we anticipate that the string of record monthly temperatures will continue to a total of 12 and possibly 13 months because of Earth’s unprecedented energy imbalance. By May the 12-month running-mean global temperature relative to 1880-1920 should be +1.6-1.7°C and not fall below +1.4 ± 0.1°C during the next La Nina minimum. Thus, given the planetary energy imbalance, it will be clear that the 1.5°C ceiling has been passed for all practical purposes.
Zeke Hausfather memorably termed the record September global temperature as “gobsmackingly bananas.” Subsequent monthly temperature anomalies have not been much smaller. These records coincide with a moderately strong El Nino, but they exceed expectations for even the strongest El Nino, if that were the only driving factor. Warming is also being driven by another factor, one that
Fig. 2. Global absorbed solar radiation (W/m² ) relative to mean of the first 120 months of CERES data. CERES data² are available at http://ceres.larc.nasa.gov/
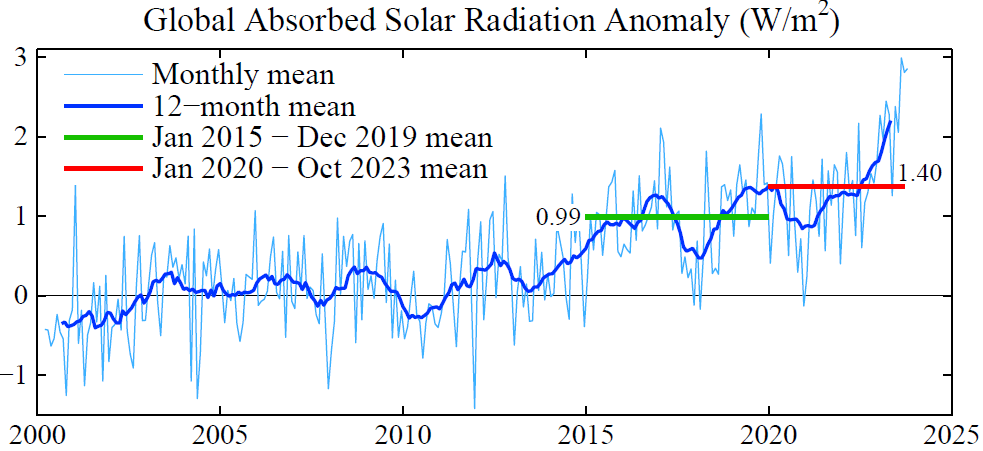
Fig. 3. 12-month running-mean of Earth’s energy imbalance from CERES satellite data normalized to 0.71 W/m² mean for July 2005 – June 2015 (blue bar) from in situ data.

is ultimately more consequential: a large decrease of Earth’s albedo. In other words, Earth has become darker, absorbing more of the sunlight incident on the planet (Fig. 2). The increase of absorbed solar radiation (1.4 W/m² ) is a decrease of Earth’s albedo (reflectivity) of 0.4% (1.4/340).³ This reduced albedo is equivalent to a sudden increase of atmospheric CO₂ from 420 to 530 ppm.
We conclude in our Pipeline paper⁴ that the decreased albedo is spurred by reduced atmospheric aerosols and enhanced by feedbacks. Given that NASA decided in the early 1990s⁵ not to make precise measurements of the global aerosol forcing and cloud feedbacks, we are faced with a difficult task of sorting out how much of the increased solar absorption is aerosol forcing and how much is from feedbacks. The two major feedbacks expected to darken Earth as the planet warms are reduced sea ice cover and reduced cloud cover. The recent spike of absorbed solar radiation to almost 3 W/m² (Fig. 2) may be related in part to the fact that it occurred during the season when solar insolation was rising in the region of Southern Hemisphere sea ice when sea ice cover was at its lowest point in the period of satellite data. Large variability of clouds, unforced and forced, complicates interpretation of anomalies, but spatial variations may help untangle the situation.
Feedbacks associated with ice melt are particularly important for reasons discussed in our Ice Melt paper⁶ (that’s the paper blackballed by IPCC because it disagrees with IPCC about the imminent threat of shutdown of the overturning ocean circulations and large sea level rise). We find in that paper that freshwater injection into the ocean mixed layer by melting polar ice is already a significant climate forcing that acts to slow down the production of deepwater in the North Atlantic and production of bottom water in the Southern Ocean.
…
¹ Daily Surface Air Temperature graph based on ERA5 available via Climate Reanalyzer, Climate Change Institute, University of Maine https://climatereanalyzer.org/wx/todays-weather/?var_id=t2&ortho=1&wt=1
² Loeb NG, Johnson GC, Thorsen, TJ et al. Satellite and ocean data reveal marked increase in Earth’s heating rate. Geophys Res Lett 2021;48:e2021GL09304
³ The average solar energy incident on Earth is about 340 W/m².
⁴ Hansen J, Sato M, Simons L et al. Global warming in the pipeline. Oxford Open Clim Chan 2023;3(1):kgad008, doi.org/10.1093/oxfclm/kgad008
⁵ Hansen J, Rosa W, Fung I. Long-term monitoring of global climate forcings and feedbacks. Washington: NASA Conference Publication 3234, 1993
⁶ Hansen J, Sato M, Hearty P et al. Ice melt, sea level rise and superstorms: evidence from paleoclimate data, climate modeling, and modern observations that 2 C global warming could be dangerous. Atmos Chem Phys2016;16:3761-812
…
NOVA: The Invisible Flame (BBC 1978)
This 1980 episode of the PBS science program NOVA introduces hydrogen as an alternative to petroleum and natural gas. They look at safety, generation, transportation (pipelines and trucks) storage and use. They show vehicles converted to use hydrogen, including a proposed passenger jet and a “hydrogen home” with a hydrogen stove and oven. They also show a home “electrolyzer” for refueling your hydrogen powered car.
Near the end they look at fuel cells, saying that they would be more efficient than using hydrogen in an internal combustion engine and introduce a possible, looming concern, CO₂ and the possibility that it might lead to problems in as little as 10 years (8 years later, James Hansen would give his famous congressional testimony.) A prediction is made that at that time, a global effort will be made to move away from the use of “fossil fuels.”
In my opinion, it’s a balanced presentation, and worthwhile viewing for hydrogen advocates and skeptics alike. The science really has not changed all that much in 40+ years.
https://archive.org/details/NOVATheInvisibleFlame
I notice that while NOVA ran this in 1980, the BBC credit at the end gives a date of 1978.
James Hansen, et al: "A Miracle Will Occur" Is Not Sensible Climate Policy
“A Miracle Will Occur” Is Not Sensible Climate PolicyJames Hansen, Pushker Kharecha, Makiko Sato
The COP28 Chairman and the United Nations Secretary General say that the goal to keep global warming below 1.5°C is alive, albeit barely, implying that the looser goal of the 2015 Paris Agreement (to keep warming well below 2°C) is still viable. We find that even the 2°C goal is dead if policy is limited to emission reductions and plausible CO₂ removal. IPCC (the Intergovernmental Panel on Climate Change, which advises the UN) has understated global warming in the pipeline and understated fossil fuel emissions in the pipeline via lack of realism in the Integrated Assessment Models that IPCC uses for climate projections. Wishful thinking as a policy approach must be replaced by transparent climate analysis, knowledge of the forcings that drive climate change, and realistic assessment of policy options. The next several years provide a narrow window of time to define actions that could still achieve a bright future for today’s young people. We owe young people the knowledge and the tools to continually assess the situation and devise and adjust the course of action.
Our approach to analysis of global climate change, as described in Global Warming in the Pipeline,¹ puts comparable emphasis on (1) Earth’s paleoclimate history, (2) global climate models (GCMs), (3) modern observations of climate processes and climate change. One purpose of the Pipeline paper was to distinguish between this approach and that of IPCC, which puts principal emphasis on GCMs. GCMs are an essential tool, but the models must be consistent with Earth’s history and the projections of future climate must employ plausible scenarios for energy use and for the climate forcings that drive climate change.
Policy implications of climate science can be grasped from a basic understanding of the human-made forcings that are driving Earth’s climate away from the relatively stable climate of the Holocene (approximately the past 10,000 years). Our task is to provide understandable quantification of climate forcings and changes that will be needed to maintain a hospitable climate. Concerned public, including policymakers, must learn to appreciate basic graphs that summarize real-world data, because these must provide the basis for policy discussion.
1. CLIMATE SCIENCE
There are two major climate forcings: human-made greenhouse gases (GHGs) and aerosols (fine airborne particles). GHGs reduce Earth’s thermal (heat) radiation to space and are the main cause of global warming. Aerosols reflect sunlight to space, mainly via their effect as condensation nuclei for clouds; more nuclei lead to smaller cloud drops and brighter, longerlived, clouds. Aerosols thus cause a global cooling that partially offsets GHG warming.
…
Hansen et al. - 2023 - Global warming in the pipeline
https://doi.org/10.1093/oxfclm/kgad008
Perspective article
Global warming in the pipeline
James E. Hansen¹*, Makiko Sato¹, Leon Simons², Larissa S. Nazarenko³,⁴, Isabelle Sangha¹, Pushker Kharecha¹, James C. Zachos⁵, Karina von Schuckmann⁶, Norman G. Loeb⁷, Matthew B. Osman⁸, Qinjian Jin⁹, George Tselioudis³, Eunbi Jeong¹⁰, Andrew Lacis³, Reto Ruedy³,¹¹, Gary Russell³, Junji Cao¹², Jing Li¹³
¹ Climate Science, Awareness and Solutions, Columbia University Earth Institute, New York, NY, USA
² The Club of Rome Netherlands, ‘s-Hertogenbosch, The Netherlands
³ NASA Goddard Institute for Space Studies, New York, NY, USA
⁴ Center for Climate Systems Research, Columbia University Earth Institute, New York, NY, USA
⁵ Earth and Planetary Science, University of CA, Santa Cruz, CA, USA
⁶ Mercator Ocean International, Ramonville St., -Agne, France
⁷ NASA Langley Research Center, Hampton, VA, USA
⁸ Department of Geosciences, University of AZ, Tucson, AZ, USA
⁹ Department of Geography and Atmospheric Science, University of KS, Lawrence, KS, USA
¹⁰ CSAS KOREA, Goyang, Gyeonggi-do, South Korea
¹¹ Business Integra, Inc, New York, NY, USA
¹² Institute of Atmospheric Physics, Chinese Academy of Sciences, Beijing, China
¹³ Department of Atmospheric and Oceanic Sciences, School of Physics, Peking University, Beijing, China
* Correspondence address. Director of Climate Science, Awareness and Solutions, Earth Institute, Columbia University, 475 Riverside Drive, Ste. 401-O, New York, NY 10115, USA. E-mail: jeh1@columbia.edu
Abstract
Improved knowledge of glacial-to-interglacial global temperature change yields Charney (fast-feedback) equilibrium climate sensitivity 1.2 ± 0.3°C (2r) per W/m², which is 4.8°C ± 1.2°C for doubled CO₂. Consistent analysis of temperature over the full Cenozoic era—including ‘slow’ feedbacks by ice sheets and trace gases—supports this sensitivity and implies that CO₂ was 300–350 ppm in the Pliocene and about 450 ppm at transition to a nearly ice-free planet, exposing unrealistic lethargy of ice sheet models. Equilibrium global warming for today’s GHG amount is 10°C, which is reduced to 8°C by today’s human-made aerosols. Equilibrium warming is not ‘committed’ warming; rapid phaseout of GHG emissions would prevent most equilibrium warming from occurring. However, decline of aerosol emissions since 2010 should increase the 1970–2010 global warming rate of 0.18°C per decade to a post-2010 rate of at least 0.27°C per decade. Thus, under the present geopolitical approach to GHG emissions, global warming will exceed 1.5°C in the 2020s and 2°C before 2050. Impacts on people and nature will accelerate as global warming increases hydrologic (weather) extremes. The enormity of consequences demands a return to Holocene-level global temperature. Required actions include: (1) a global increasing price on GHG emissions accompanied by development of abundant, affordable, dispatchable clean energy, (2) East-West cooperation in a way that accommodates developing world needs, and (3) intervention with Earth’s radiation imbalance to phase down today’s massive human-made ‘geo-transformation’ of Earth’s climate. Current political crises present an opportunity for reset, especially if young people can grasp their situation.
Keywords: Aerosols; Climate Sensitivity; Paleoclimate; Global Warming; Energy Policy; Cenozoic
Background information and structure of paper
It has been known since the 1800s that infrared-absorbing (greenhouse) gases (GHGs) warm Earth’s surface and that the abundance of GHGs changes naturally as well as from human actions [1, 2].¹ Roger Revelle wrote in 1965 that we are conducting a ‘vast geophysical experiment’ by burning fossil fuels that accumulated in Earth’s crust over hundreds of millions of years [3] Carbon dioxide (CO₂ ) in the air is now increasing and already has reached levels that have not existed for millions of years, with consequences that have yet to be determined. Jule Charney led a study in 1979 by the United States National Academy of Sciences that concluded that doubling of atmospheric CO₂ was likely to cause global warming of 3 ± 1.5°C [4]. Charney added: ‘However, we believe it is quite possible that the capacity of the intermediate waters of the ocean to absorb heat could delay the estimated warming by several decades.’ After U.S. President Jimmy Carter signed the 1980 Energy Security Act, which included a focus on unconventional fossil fuels such as coal gasification and rock fracturing (‘fracking’) to extract shale oil and tight gas, the U.S. Congress asked the National Academy of Sciences again to assess potential climate effects. Their massive Changing Climate report had a measured tone on energy policy—amounting to a call for research [5]. Was not enough known to caution lawmakers against taxpayer subsidy of the most carbon-intensive fossil fuels? Perhaps the equanimity was due in part to a major error: the report assumed that the delay of global warming caused by the ocean’s thermal inertia is 15 years, independent of climate sensitivity. With that assumption, they concluded that climate sensitivity for 2 × CO₂ is near or below the low end of Charney’s 1.5–4.5°C range. If climate sensitivity was low and the lag between emissions and climate response was only 15 years, climate change would not be nearly the threat that it is. Simultaneous with preparation of Changing Climate, climate sensitivity was addressed at the 1982 Ewing Symposium at the Lamont Doherty Geophysical Observatory of Columbia University on 25–27 October, with papers published in January 1984 as a monograph of the American Geophysical Union [6]. Paleoclimate data and global climate modeling together led to an inference that climate sensitivity is in the range 2.5–5°C for 2 × CO₂ and that climate response time to a forcing is of the order of a century, not 15 years [7]. Thus, the concept that a large amount of additional human-made warming is already ‘in the pipeline’ was introduced. E.E. David, Jr, President of Exxon Research and Engineering, in his keynote talk at the symposium insightfully noted [8]: ‘The critical problem is that the environmental impacts of the CO₂ buildup may be so long delayed. A look at the theory of feedback systems shows that where there is such a long delay, the system breaks down, unless there is anticipation built into the loop.’
Thus, the danger caused by climate’s delayed response and the need for anticipatory action to alter the course of fossil fuel development was apparent to scientists and the fossil fuel industry 40 years ago.² Yet industry chose to long deny the need to change energy course [9], and now, while governments and financial interests connive, most industry adopts a ‘greenwash’ approach that threatens to lock in perilous consequences for humanity. Scientists will share responsibility if we allow governments to rely on goals for future global GHG levels, as if targets had meaning in the absence of policies required to achieve them.
The Intergovernmental Panel on Climate Change (IPCC) was established in 1988 to provide scientific assessments on the state of knowledge about climate change [10] and almost all nations agreed to the 1992 United Nations Framework Convention on Climate Change [11] with the objective to avert ‘dangerous anthropogenic interference with the climate system’. The current IPCC Working Group 1 report [12] provides a best estimate of 3°C for equilibrium global climate sensitivity to 2 × CO₂ and describes shutdown of the overturning ocean circulations and large sea level rise on the century time scale as ‘high impact, low probability’ even under extreme GHG growth scenarios. This contrasts with ‘high impact, high probability’ assessments reached in a paper [13]—hereafter abbreviated Ice Melt—that several of us published in 2016. Recently, our paper’s first author (JEH) described a long-time effort to understand the effect of ocean mixing and aerosols on observed and projected climate change, which led to a conclusion that most climate models are unrealistically insensitive to freshwater injected by melting ice and that ice sheet models are unrealistically lethargic in the face of rapid, large climate change [14].
…
James Hansen Webinar: An Intimate Conversation with Leading Climate Scientists To Discuss New Research on Global Warming
NREL: The Four Phases of Storage Deployment: A Framework for the Expanding Role of Storage in the U.S. Power System
(Please note, this is a publication of a national research lab. Copyright concerns are nil.)
Storage Futures Study
The Four Phases of Storage Deployment: A Framework for the Expanding Role of Storage in the U.S. Power System (PDF)
Preface
This report is one in a series of NREL’s Storage Futures Study (SFS) publications. The SFS is a multiyear research project that explores the role and impact of energy storage in the evolution and operation of the U.S. power sector. The SFS is designed to examine the potential impact of energy storage technology advancement on the deployment of utility-scale storage and the adoption of distributed storage, and the implications for future power system infrastructure investment and operations. The research findings and supporting data will be published as a series of publications. The table on the next page lists the planned publications and specific research topics they will examine under the SFS.
This report, the first in the SFS series, explores the roles and opportunities for new, cost- competitive stationary energy storage with a conceptual framework based on four phases of current and potential future storage deployment, and presents a value proposition for energy storage that could result in substantial new cost-effective deployments. This conceptual framework provides a broader context for consideration of the later reports in the series, including the detailed results of the modeling and analysis of power system evolution scenarios and their operational implications.
The SFS series provides data and analysis in support of the U.S. Department of Energy’s Energy Storage Grand Challenge, a comprehensive program to accelerate the development, commercialization, and utilization of next-generation energy storage technologies and sustain American global leadership in energy storage. The Energy Storage Grand Challenge employs a use case framework to ensure storage technologies can cost-effectively meet specific needs, and it incorporates a broad range of technologies in several categories: electrochemical, electromechanical, thermal, flexible generation, flexible buildings, and power electronics.
More information, any supporting data associated with this report, links to other reports in the series, and other information about the broader study are available at https://www.nrel.gov/analysis/storage-futures.html.
…
Executive Summary
The U.S. electricity system currently has about 24 GW of stationary energy storage with the majority of it being in the form of pumped storage hydropower (PSH). Given changing technologies and market conditions, the deployment expected in the coming decades is likely to include a mix of technologies. Declining costs of energy storage are increasing the likelihood that storage will grow in importance in the U.S. power system. This work uses insights from recent deployment trends, projections, and analyses to develop a framework that characterizes the value proposition of storage as a way to help utilities, regulators, and developers be better prepared for the role storage might play and to understand the need for careful analysis to ensure cost-optimal storage deployment.
To explore the roles and opportunities for new cost-competitive stationary energy storage, we use a conceptual framework based on four phases of current and potential future storage deployment (see Table ES-1). The four phases, which progress from shorter to longer duration, link the key metric of storage duration to possible future deployment opportunities, considering how the cost and value vary as a function of duration.
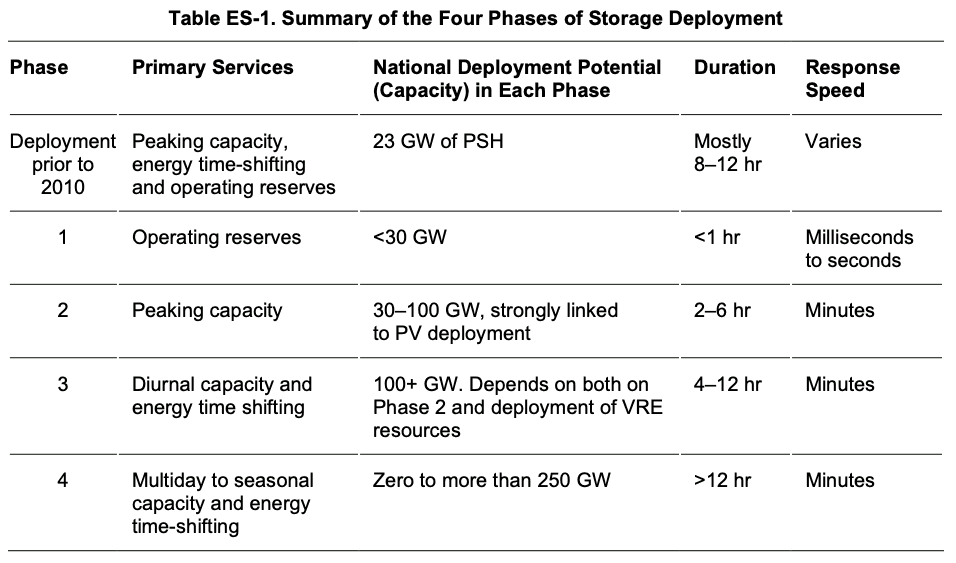
The 23 GW of PSH in the United States was built mostly before 1990 to provide peaking capacity and energy time-shifting for large, less flexible capacity. The economics of PSH allowed for deployment with multiple hours of capacity that allowed it to provide multiple grid services. These plants continue to provide valuable grid services that span the four phases framework, and their use has evolved to respond to a changing grid. However, a variety of factors led to a multidecade pause in new development with little storage deployment occurring from about 1990 until 2011.¹
Changing market conditions, such as the introduction of wholesale electricity markets and new technologies suggest storage deployment since 2011 may follow a somewhat different path, diverging from the deployment of exclusively 8+hour PSH. Instead, more recent deployment of storage has largely begun with shorter-duration storage, and we anticipate that new storage deployment will follow a trend of increasing durations.
We characterize this trend in our four phases framework, which captures how both the cost and value of storage changes as a function of duration. Many storage technologies have a significant cost associated with increasing the duration, or actual energy stored per unit of power capacity. In contrast, the value of most grid services does not necessarily increase with increasing asset duration—it may have no increase in value beyond a certain duration, or its value may increase at a rapidly diminishing rate. As a result, the economic performance of most storage technologies will rapidly decline beyond a certain duration. In current U.S. electricity markets, the value of many grid services can be captured by discrete and relatively short-duration storage (such as less than 1 hour for most operating reserves or 4 hours for capacity).
Together, the increasing cost of storage with duration and the lack of incremental value with increasing storage duration will likely contribute to growth of storage in the U.S. power sector that is characterized by a progression of deployments that aligns duration with specific services and storage technologies.
The four phases conceptual framework introduced in this work is a simplification of a more complicated evolution of the stationary energy storage industry and the power system as a whole. While we present four distinct phases, the boundaries between each phase will be somewhat indistinct and transitions between phases will occur at different times in different regions as various markets for specific services are saturated, and phases can overlap within a region. These transitions and the total market sizes are strongly influenced by the regional deployment of variable renewable energy (VRE) as well as hybrid deployments. However, we believe it is a useful framework to consider the role of different storage technologies, and particularly the importance of duration in driving adoption in each phase.
Phase 1, which began around 2011, is characterized by the deployment of storage with 1-hour or shorter duration, and it resulted from the emergence of restructured markets and new technologies that allow for cost-competitive provision of operating reserves, including regulating reserves. Potential deployment of short-duration storage in Phase 1 is bounded by the overall requirements for operating reserves, which is less than 30 GW in the United States even when including regulating reserves, spinning contingency reserves, and frequency responsive reserves, some of which are not yet a widely compensated service.
Phase 2 is characterized by the deployment of storage with 2–6 hours of discharge duration to serve as peaking capacity. Phase 2 has begun in some regions, with lithium-ion batteries becoming cost-competitive where durations of 2–6 hours are sufficient to provide reliable peaking capacity. As prices continue to fall, batteries are expected to become cost-competitive in more locations. These storage assets derive much of their value from the replacement of traditional peaking resources, (primarily natural gas-fired combustion turbines), but they also take value from time-shifting/energy arbitrage of energy supply. The potential opportunities of Phase 2 are limited by the local or regional length of the peak demand period and have a lower bound of about 40 GW. However, the length of peak demand is highly affected by the deployment of VRE, specifically solar photovoltaics (PV), which narrows the peak demand period. Phase 2 is characterized in part by the positive feedback between PV increasing the value of storage (increasing its ability to provide capacity) and storage increasing the value of PV (increasing its energy value by shifting it output to periods of greater demand). Thus, greater deployment of solar PV could extend the storage potential of Phase 2 to more than 100 GW in the United States in scenarios where 25% of the nation’s electricity is derived from solar.
Phase 3 is less distinct, but is characterized by lower costs and technology improvements that enable storage to be cost-competitive while serving longer-duration (4–12 hour) peaks. These longer net load peaks can result from the addition of substantial 2–6 hour storage deployed in Phase 2. Deployment in Phase 3 could include a variety of new technologies and could also see a reemergence of pumped storage, taking advantage of new technologies that reduce costs and siting constraints while exploiting the 8+ hour durations typical of many pumped storage facilities. The technology options for Phase 3 include next-generation compressed air and various thermal or mechanical-based storage technologies. Also, storage in this phase might provide additional sources of value, such as transmission deferral and additional time-shifting of solar and wind generation to address diurnal mismatches of supply and demand. Our scenario analysis identified 100 GW or more of potential opportunities for Phase 3 in the United States, in addition to the existing PSH that provides valuable capacity in several regions. Of note for both Phase 2 and 3 is a likely mix of configurations, with some stand-alone storage, but also a potentially significant fraction of storage deployments associated with hybrid plants, where storage can take advantage of tax credits, or shared capital and operating expenses. As in Phase 2, additional VRE, especially solar PV, could extend the storage potential of Phase 3, enabling contributions of VRE exceeding 50% on an annual basis.
Phase 4 is the most uncertain of our phases. It characterizes a possible future in which storage with durations from days to months is used to achieve very high levels of renewable energy (RE) in the power sector, or as part of multisector decarbonization. Technologies options in this space include production of liquid and gas fuels, which can be stored in large underground formations that enable extremely long-duration storage with very low loss rates. This low loss rate allows for seasonal shifting of RE supply, and generation of a carbon-free fuel for industrial processes and feedstocks. Phase 4 technologies are generally characterized by high power-related costs associated with fuel production and use but with very low duration-related costs. Thus, traditional metrics such as cost per kilowatt-hour of storage capacity are less useful, and when combined with the potential use of fuels for non-electric sector applications, makes comparison of Phase 4 technologies with other storage technologies more difficult. The potential opportunities for Phase 4 technologies measure in the hundreds of gigawatts in the United States, and these technologies could potentially address the residual demand that is very difficult or expensive to meet with RE resources and storage deployed in Phases 1–3.
Our four phases framework is intended to describe a plausible evolution of cost-competitive storage technologies, but more importantly, it identifies key elements needed for stakeholders to evaluate alternative pathways for both storage and other sources of system flexibility. Specifically, an improved characterization of various grid services needed, including capacity and duration, could help provide a deeper understanding of the tradeoffs between various technologies, and non-storage resources such as responsive demand. Such a characterization would help ensure the mix of flexibility technologies deployed is robust to an evolving a grid, which will ultimately determine the amount of storage and flexibility the power system will need.
…
James Hansen: To Understand and Protect the Home Planet
To Understand and Protect the Home Planet (PDF)James Hansen
Global Warming in the Pipeline will be published in Oxford Open Climate Change of Oxford University Press next week. The paper describes an alternative perspective on global climate change – alternative to that of the Intergovernmental Panel on Climate Change (IPCC), which provides scientific advice on climate change to the United Nations.
Our paper may be read as being critical of IPCC. But we have no criticism of individual scientists, who include world-leading researchers volunteering their time to produce IPCC reports. Rather we are questioning whether the IPCC procedure and product yield the advice that the public, especially young people, need to understand and protect their home planet.
Discussion of our paper will likely focus on differences between our conclusions and those of IPCC. I hope, however, that it may lead to consideration of some basic underlying matters.
Three-pronged analysis. IPCC climate analysis leans heavily on GCMs (global climate models), too heavily in my opinion. We prefer a comparable weight on (1) information from Earth’s paleoclimate history, (2) GCMs, and (3) observations of ongoing climate processes and climate change. This 3-pronged approach can result in rather complex papers, but, so, too, is the real-world complex. We use this 3-pronged approach in both the heavily peer-reviewed paper, “Ice Melt, Sea Level Rise, and Superstorms,” published in 2016 and in our present “Global Warming in the Pipeline” (these papers hereinafter abbreviated as Ice Melt and Pipeline, respectively). Below I note specific travails and consequences for the Ice Melt paper that resulted from the fact that our 3-pronged approach differed from that of IPCC. I hope that some explanation here may help avoid a similar fate for Pipeline, as the world is running short on time to develop a strategy to preserve a propitious climate for today’s young people and their children.
…
Profile Information
Member since: Mon Mar 6, 2006, 04:51 PMNumber of posts: 19,938