NNadir
NNadir's JournalAbsorption of Sulfur Dioxide by Deep Eutectic Solvents
The paper I will discuss in this post is this one: Role of Hydrophilic Ammonium-Based Deep Eutectic Solvents in SO2 Absorption (Duan et al Energy Fuels 2020, 34, 1, 74-81.)
All of the waste products resulting from the combustion of dangerous fossil fuels are harmful, the most serious of course being carbon dioxide over the long term, but in terms of immediate health consequences, the carcinogens found in particulates are probably responsible for the majority of the millions of deaths dangerous fossil fuel waste each year. This said, none of the other pollutants are harmless. I sometimes muse to myself whether the largest source of mercury exposure, the combustion of coal, is responsible for the rising popularity of stupidity. As many educated people know, the madness of "Mad Hatters" - which was very real and not merely a literary invention - was the result of the use, by hatters, in the 18th and 19th century, of mercury to improve the appearance of hat pins.
Mercury, since the days of "mad hatters" was further distributed by distributed medical waste in thermometers and blood pressure devices, laboratory use in anemometers and other devices - including the device used by the first American to win the Nobel Prize in Physics, Albert Michelson, who showed that the speed of light was not subject to relativistic enhancement by the speed of the Earth's revolution around the sun, inspiring Albert Einstein's famous theory on this subject. It is still also widely used in gold mining operations, which is also represents, both in abandoned and operative gold mines, a serious source of mercury pollution.
However, the combustion of coal is still the major source of mercury pollution. Despite all the popularly believed rhetoric that "coal is dead," especially when it is raised as "proof" on an absurd but widely held belief that so called "renewable energy" is great, as I often note, in this century, coal has been the fastest growing source of energy on this planet, by far, followed by dangerous natural gas, followed by petroleum. The use of dangerous fossil fuels is rising and is doing so rapidly. If you think we are either doing something or going to do something about this state of affairs, sorry, you are lying to yourself.
Another major pollutant, probably dwarfed by particulates and heavy metals - not limited to mercury but also including the other major neurotoxin lead, and the element that is the subject of much mysticism, uranium - release by the combustion of coal consists of the two oxides of sulfur, SO2 and SO3, sulfur dioxide and sulfur trioxide. The latter is the anhydride of sulfuric acid. In the presence of water, it forms sulfuric acid, which is now a constituent of clouds where it leads to acid rain (along with nitrogen oxides).
This paper is about sulfur dioxide.
I favor the immediate phase out of dangerous fossil fuels - not by using so called "renewable energy" which will remain, as it always has, spectacularly incapable of addressing any major environmental problem since it is neither sustainable nor safe nor clean, but by the form of energy that many people, regrettably some Presidential candidates who wish to be thought of as being "green," nuclear energy. The idea of phasing out nuclear energy, as opposed to rapidly expanding it on an emergency basis, is definitely in mad hatter territory. Indeed, my speculation about the effect of mercury and lead aerosols released by dangerous fossil fuel combustion as having a bearing on the mass insanity that is on the rise, everywhere, is driven a consideration by the popular insanity with respect to nuclear energy, among many other things. Nuclear energy is not risk free, but it doesn't need to be risk free to save lives overall. The situation is best described by the existence of ambulances. Ambulances travel at high and potentially dangerous speeds, ignoring traffic laws, and, as the operate, releasing deadly dangerous fossil fuel wastes from their tailpipes. However the existence of ambulances has clearly saved more lives than it has cost, and so, rightly, we accept the existence of ambulances, even knowing that they are potentially very dangerous devices.
Ambulance Safety NHTSB Infographic.
Shutting perfectly operable nuclear power plants kills people; this is true in Germany; it is true in California, Massachusetts and Vermont. It is true anywhere nuclear power plants are shut by appeals to fear and ignorance.
To return almost to the point, and get off my continuously mounted soapbox, the paper listed above is very much about the continued use of coal, and is a description of putting lipstick on the expanding coal pig, by offering a route to reducing just one of the pollutants, not even the most important pollutants. Along with so called "renewable energy" which is also lipstick on the coal, petroleum and gas pig, there is no technology that can make fossil fuels acceptably safe, especially because nuclear energy is now so well understood, and neither fossil fuels, or reactionary rhetoric about so called "renewable energy" can make any technology as safe and as sustainable as nuclear energy.
Nevertheless, it is well worth considering this paper even if one is an environmentalist who favors the immediate phase out of all dangerous fossil fuels. Here's why: Because we hate our children so much as to insist them to enslave themselves to clean up our mess, because we have done exactly zero beyond issuing well meaning platitudes to address climate change, it will be necessary for future generations to remove carbon dioxide from the air. The engineering of this task is extremely challenging, extremely expensive, and very energy intensive. The largest source of so called "renewable energy" - biomass - is currently the second largest, after dangerous fossil fuels - cause of energy related deaths, the majority of which are currently involved in air pollution, although extreme weather is catching up.
However, one thing that biomass does, as it is self replicating and can more or less spontaneously cover huge surface areas cheaply, and because it has evolved to a combinatorially optimized point over billions of years, is to concentrate carbon from the atmosphere. Recently in this space, citing a paper on an issue in biomass closed (smokestack free) combustion, corrosion, I pointed out that sulfur is an essential element in living systems. Thus the treatment of biomass to recover the carbon in it will necessary involve sulfur, either in the extremely reduced (and highly toxic) form as H2S gas, or as sulfur oxides.
In addition, as I noted in passing, one widely discussed thermochemical cycle for splitting water is the sulfur iodine cycle. In the oxygen generating portion of this cycle, only 33% of the evolved gases after the condensation of water is oxygen. 67% is sulfur dioxide. I stopped thinking about the sulfur-iodine cycle a few years back because of mass transfer issues, but recently, having been exposed indirectly to new insights, I'm thinking about it again, and thus this paper, which is about the separation of sulfur dioxide from a gas stream - in this case flue waste - is of some interest to me, which is not to say that I think that the sulfur iodine cycle is the best thermochemical cycle - I actually favor Allam cycle coupled metal based carbon dioxide splitting cycles - but it is nonetheless worth considering. I recall reading a few years back that the Chinese were working on piloting this cycle with nuclear energy, but having (temporarily) lost interest, I didn't follow up to see if this actually happened.
Anyway, from the introductory text of the paper:
Ionic liquids (ILs) have been applied in SO2 absorption. In particular, imidazolium-based ILs are excellent for SO2 absorption.(5,6) Hong found that the ability to absorb SO2 was related to the numbers of ether groups on ILs, as the ether-functional group could enhance the physical reaction between SO2and ILs. [E8min][MeSO3] could absorb 6.30 mol SO2 g–1 ILs at 30 °C and under atmospheric pressure.(7) Lee et al. reported the absorbing behavior of [Bztmeda][MeSO3].(8) However, with further investigation, the toxic and recalcitrant ILs could arguably cause environmental damage.(9) Deep eutectic solvents (DESs), as a new kind of greener and cost-efficient solvents, have been used widely in gas separation.(10?13) Han et al. synthesized choline chloride (ChCl)-based DESs and reported that ChCl/glycol, ChCl/glycerin, and ChCl/hexamethylene glycol could successfully absorb SO2. The absorption ability increased with the concentration of ChCl and could reach 0.678 g SO2g–1 DESs.(14) Deng prepared ChCl/levulinic acid and applied it for SO2absorption. With the calculated absorption enthalpy, the thermodynamic properties were investigated.(15) Liu investigated the absorption capacity of phenol-based DESs for SO2 at 293.15–323.15 K and 0–1.0 bar, reaching the capacity of 0.528 g SO2 g–1 DES.(16) Hydrophilic DESs have been a promising SO2 absorbent. However, the high viscosity is one of the significant characteristics of DESs. For example, the viscosity of ChCl-based DESs is usually higher than 2000 mPa·s.(17,18) This viscosity creates a mass-transfer barrier in the gas–liquid (SO2–absorbent) reaction, and thus, SO2 absorption is greatly limited.(19)
To investigate the mass-transfer barrier in SO2 absorption, a kind of hydrophilic deep eutectic solvents (DESs) and their hydrates were prepared to solve the relatively viscosity of DESs in SO2 absorption. The effects of tetrabutylammonium halogen/caprolactam (TBAB/CPL) DESs were investigated systematically, and the hydrophilic interfacial reaction was studied to explore the absorption mechanism of SO2 absorption in DESs.
A deep eutectic solvent is a solvent that has a lower melting point - a melting point lower than its individual components in the absence of the others - than "ambient temperatures, generally taken to be 25°C.
The rest of the story can be pretty much appreciated merely by looking at the pictures and their captions:

The caption:

The caption:

The caption:

The caption:

The caption:

The caption:
There is considerable discussion in the paper on the properties of the interface, to which the above graphic alludes. The interface is, of course, an important issue in gas absorption, as further explored in the text referring to the next graphic:

The caption:

The caption:

The caption:
It may be useful for anyone who may wish to explore this conception further, to give some commentary on spectra and mechanism.
Some of the remarks on spectra:

The caption:

Some remarks in the paper on mechanism:

The caption:

The caption:

The caption:

The caption:
A caveat here concerns the stability of these reagents. To the extent that this reagents are exposed to acids, and one would imagine that a SO2 stream will necessarily be acidic, the stability of caprolactam to ring opening is certainly a major consideration.
Personally - and this is just a comment from the "peanut gallery" since I have not worked personally or directly with ionic liquids although I'm well acquainted with them - I think the ionic liquid routes are probably a better choice, since their toxicology can almost certainly be managed.
I don't necessarily like the way the solvents are regenerated, which seems to involve the use of a nitrogen stream, meaning the SO2 gas is impure and will need further processing.
Have a nice day tomorrow.
Flame Interactions of K, S Cl and CO in Oxygen Enriched Atmospheres.
The paper I'll discuss in this post is this one: Chemical Interactions between Potassium, Sulfur, Chlorine, and Carbon Monoxide in Air and Oxy-fuel Atmospheres (Thomas Allgurén and Klas Andersson, Energy & Fuels 2020, 34, 900?906).
Energy & Fuels, a publication of the American Chemical Society, an organization of which I am a long time member, is a journal I access every month, even though most issues are chock full of papers about a topic I absolutely deplore, dangerous fossil fuels. Of course, there are papers about dangerous fossil fuels that are well worth reading because the science therein may well prove to apply to things that actually are safe and sustainable. It is often the case that useful information can be obtained about energy and the environment by reading about systems that are either insidious or won't work, or are a little bit of both. For example I read papers all the time about making fuels using solar thermal plants, even though the small number of solar thermal plants that have actually been built end up being expensive, unreliable junk that damages or destroys pristine desert habitats. The reason is that the technologies that appear in solar thermal papers are adaptable to any source of high temperatures, even those that work. Many thermochemical cycles for splitting carbon dioxide, water or both, for example, make the requisite popularly driven genuflection to so called "renewable energy" but despite this appeal to unsustainable technologies, would work quite well with cleaner and far more sustainable nuclear energy.
This paper, cited at the outset, is not about technology that is directly applicable to nuclear energy, but it is very much about a product that is very useful for the removal of carbon dioxide from the air, pure oxygen, this being a side product of water or carbon dioxide splitting. The paper briefly mentions how this might work, specifically in the safe combustion of biomass (and or municipal garbage) in such a way as to make smoke stacks unnecessary. This type of combustion is called "oxy-fuel" combustion.
The combustion of biomass and/or municipal wastes is responsible for slightly less than half of the air pollution deaths which kill people continuously, at a rate of about 19,000 people per day while airheads run around complaining about so called "nuclear waste," which has a spectacular record of not killing anyone.
This is the world we live in. No wonder we now have a party - one dominated by a corrupt uneducated immoral moron - of people who used to wrap themselves in a flag threatening to nuke the planet to fight communism now bending all over itself to kiss the sphincter of a former KGB agent who now runs Russia.
And, it's not just them. We now have "environmentalists" who applaud the ripping up of wilderness for roads for trucks to drag wind turbine parts made from strip mined materials on diesel trucks.
Anyway, there is a difficulty with the combustion of biomass that anyone who has run a fireplace for a few decades will recognize. Biomass combustion effluents are not only toxic; they are corrosive.
I have been thinking and reading about this problem for quite some time: I'm jealous of my son studying materials science engineering and I'm always openly or surreptitiously working to pick his brain.
That's why this paper appealed to me.
From the introduction:
A point: Reference 4, featuring the "4%" figure in "percent talk" - the talk that proponents of the wind and solar industry utilize to obscure its obvious failure of these hyped industries to address climate change - is not about total energy but rather about electricity. Specifically the reference is this: (4) International Energy Agency (IEA). Electricity Information 2016;
IEA: Paris, France, 2016; ISBN: 978-92-64-25865-5. After half a century of wild cheering, according to the 2019 edition of the World Energy Outlook, also published by the IEA but about primary energy, not electrical energy, as of 2018 all the world's solar, wind, tidal and geothermal sources on the planet produced 12.26 exajoules of energy out of 599.34 exajoules of energy consumed by humanity, in "percent talk," 2.04%.
The introduction continues:
An interesting possibility to reduce global warming is to combine the combustion of biofuels and CCS; this is commonly referred to as “bioenergy with carbon capture and storage” (BECCS). BECCS can help not only to reach a zero-emission target for power or industrial plants but also to achieve negative emissions locally. BECCS could be used to compensate for fossil CO2 emissions from sources for which a reduction might be more difficult to achieve. BECCS has also been proposed for the actual removal of CO2 from the atmosphere. Azar et al.(5) have shown that it is possible to reach the 2 °C target even if we, for a while, reach an atmospheric concentration of greenhouse gases otherwise considered too high, provided that BECCS is deployed.
With this background, this paper provides experimental and modeling work on the combustion chemistry relevant to fuel or fuel mixes with high concentrations of alkali, chlorine, and sulfur. The conditions are relevant for suspension-fired systems in both air–fuel and oxy-fuel combustion systems. In comparison to coal, biomass contains high levels of alkali metals and chlorine and low levels of sulfur. Given the fuel composition, significant amounts of alkali chlorides may be formed during the combustion of biomass, which increases the risk of high-temperature corrosion (HTC). However, during co-combustion of coal and biomass, fuel-bound sulfur in the coal may promote the sulfation rather than the chlorination of the alkali metals. The formation of HTC-related alkali species is investigated in the present work under both in-flame and post-flame conditions. The focus of this investigation is on the homogeneous gas-phase chemistry and includes both experimental work and detailed kinetic modeling
By the way, carbon capture and storage will not work and is not safe. However, carbon capture and use is very much worth considering. It is feasible, I think, to make materials now made through the agency of dangerous fossil fuel derived products from "Boudouard Carbon" - carbon made from the disproportionation of carbon monoxide, coal combustion in reverse, which obviously requires an energy input but is feasible with nuclear energy.
The interesting point raised in the paper is that the closed (smokestack free) combustion of biomass allows for concentrated and easy to separate carbon dioxide.
In biomass combustion in an oxygen environment - which involves high temperature - salts like potassium chloride and sodium chloride, which are always present in biomass are molten and hot enough to develop a significant vapor pressure and become gaseous and at high temperatures these salt gases are corrosive. Oxidized sulfur, from the combustion of the amino acids methionine and cysteine, as well as other thiolated molecules, generates sulfur dioxide and sulfur trioxide, the latter being the anhydride of sulfuric acid, and in the presence of steam, sulfuric acid itself.
The authors developed an apparatus to explore these gases present in flames. A schematic of the apparatus:

The caption:
The behavior of KCl was monitored by spectroscopy using a system the authors dubbed IACM (in situ alkali chloride monitor) which is shown in the following schematic:

The caption:
Other gases in the system were analyzed by a piece of apparatus called an NGA 2000 which, as I understand it is a type of compact GC with an FID (Flame Ionization Detection) system. Since I am generally not familiar with this instrument, it probably behooves me to let the authors describe their analytical system. To wit:
The combustion here did not take place in a pure oxygen atmosphere. In fact the gas supporting combustion was carbon dioxide slightly enriched, with respect to air, in oxygen, to 25% and is thus designated OF25 in the paper.
Th oxygen/carbon dioxide system is a system about which I've been thinking "thought experiments" for quite some time, and I am pleased to see it discussed here. Note that if all of the oxygen in this system is consumed, the residual gas will be a mixture of CO and CO2, depending on the amount of unoxidized fuel in the system. If water is present, it will consist of small amounts of hydrogen gas and carbon dioxide, a very interesting system.
To return though, to the present case:
The reaction conditions are described in this table, Table 1, showing the amounts of KCl and SO2 injected into the system:

The overall conditions are shown in Table 2:

Here are the flames, pictured in the air and OF25 cases with and without KCl injections:

The caption:
What is being measured here is the interaction between sulfur, oxygen and potassium, in which case a significant portion of the gas is present as HCl gas, hydrochloric acid, which is obviously corrosive.
The effect of the potassium to sulfur ratio in the next graphic shows its effect on the resulting concentrations of HCl gas:

The caption:
The "degree of sulfation" refers to the amount of potassium being in the form of K2SO4. It is defined in this equation, equation 1 in the paper:

Graphically it is shown here under various reaction conditions:

The caption:
The following figures are probably best explained with some text from the paper:
The first 2 s of residence time in the 850 and 1200 °C cases in Figure 6 were used for a reaction path analysis, as presented in Figures 7 and 8. The thicknesses of the lines in these figures are proportional to the activity levels for that specific reaction or set of reactions. There are clearly higher sulfation activities in the N2–CO and CO2–CO cases (panels a and b of Figures 7 and 8, respectively) compared to the atmospheres that do not contain any carbon monoxide (panels c and d of Figures 7 and 8). The main activity is, however, not the formation of K2SO4 but the sulfation of KCl to KSO4 and KHSO4, of which the latter is thereafter desulfated back to KCl without reacting via the final step to form potassium sulfate. These reactions create a loop that acts as a net producer of sulfur trioxide. Therefore, in the N2–CO and CO2–CO cases, the SO3 concentrations are substantially higher for temperatures of <1000 °C compared to the cases in which no CO oxidation occurs, i.e., N2reference and CO2 reference.

The next two figures show all of the species identified in the flame as recorded over a period of a few seconds and the pathways between them, as described in the excerpted text above:
Figure 7:

The caption:
"PFR" designates the reactor, a "Plugged Flow Reactor."
Figure 8:

The caption:
The disproportionation of KO- species into potassium metal is interesting; I have considered this reaction for the two higher alkali metals, rubidium and cesium for certain applications. When I was a kid this reaction would have surprised me, but now older, I am aware of it. In this setting potassium metal is only meta stable, and won't survive very long, as the pathways clearly indicate. Nevertheless at 1200°C, its formation is a major reaction.
The thermal decomposition of oxygen containing species is always of interest, although clearly in this system, the recombination is very fast, the free metal is a transitory intermediate.
The next graphic is also relevant to thermochemical water splitting, because the equilibrium it shows between SO3/H2SO4 and SO2 gas is a component of the famous and widely explored sulfur-iodine cycle, which I'm sure I've discussed somewhere on the internet, if not here. This is not my favorite thermochemical cycle, but it's growing on me, owing to certain insights as to how it may become a continuous process. Continuous processes, while they can be challenging, when fully developed are always or at least always more economically viable than batch processes. (Which is yet another reason why solar thermal schemes are doomed to economic failure.)

The caption:
A graphic relating to the presence of free radicals, which are nice things when one is getting potential pollutants to decompose.
The caption:
Finally, the effect of distance from the burner on CO concentrations with injections of SO2 and KCl:

The caption:
Although I'm generally dismissive of so called "renewable energy," biomass represents a special case, since there are areas where there is biomass as a pollutant, i.e. lakes and seas suffering from eutrophic oxygen depletion, and because biomass may represent the lowest cost path to removing the dangerous fossil fuel waste from the atmosphere.
From the paper's conclusion:
In this work, detailed kinetic modeling was performed to examine the influence on potassium chloride sulfation of CO oxidation in combination with the replacement of nitrogen with carbon dioxide. The oxidation of CO enhances the kinetics of alkali sulfation, in particular, at temperatures of <1000 °C. At higher temperatures, sulfation is promoted even further if the concentration of CO2 is also high. The experimental data presented in this work show that favorable conditions for alkali sulfation are naturally mediated by flue gas recirculation in oxy-combustion, leading to elevated SO2, CO2, and CO concentrations...
This is an esoteric but important paper, to my thinking, on engineering the removal of the dangerous fossil fuel waste carbon dioxide from the atmosphere, something future generations - all who come after us - will need to do, simply because we were rotten forebears and didn't care a whit for them.
History will not forgive us, nor should it.
Have a nice evening.
Total Synthesis of a Stereochemically Pure "Topoisomer."
The paper I'll discuss in this post is this one: Total synthesis reveals atypical atropisomerism in a small-molecule natural product, tryptorubin A (Solomon H. Reisberg1, Yang Gao1, Allison S. Walker2, Eric J. N. Helfrich2, Jon Clardy2,*, Phil S. Baran1, Science, Vol. 367, Issue 6476, pp. 458-463.
One may say "Life is unfair," because there is asymmetry in the way people are treated, an orange lunatic might with no personal merits, low intelligence and no integrity whatsoever might end up living in the White House, supported by a criminal rabble, while a person like Raoul Wallenberg might die alone, possibly under horrific conditions, in a Soviet Prison.
But life is asymmetric both in a moral sense and also in a physical sense.
This is the science section of a website devoted mostly to the issue of political ethics, and so here, we limit discussion to physical realities.
The physical asymmetry of life involves chirality, the property of objects that are not superimposable on their mirror images, the most common evocation of which are the human hand because the left hand is (more or less) the mirror image of the right, but the two hands cannot be superimposed upon each other. In fact, a word often used, even by scientists, to describe chirality is "handedness."
Most of the organic molecules in living systems possess this property of chirality, with some exceptions, for example the common amino acid glycine, and the acid pyruvic acid, but the other 19 coded proteogenic amino acids, all sugars, and all of the nucleic acids possess chirality.
In almost every case, the chirality is associated with one or more "chiral centers" where the chirality derives from the tetrahedral arrangement of bonds to saturated carbon, if these bonds are attached to four different types of groups, the molecule is chiral. Some amino acids, threonine and isoleucine have two chiral centers, and others, like sugars (which also cause the asymmetry of nucleic acids of which they are a constituent) can have many chiral centers.
However there is a somewhat unusual type of chirality that can be present without a chiral center that derives from rigid bonds to carbons that are lacking in chiral centers. Most organic chemists will be familiar with well known chiral catalysts - in order to synthetically generate a chiral center, one must introduce a chiral molecule into the synthetic pathway somewhere - based on "Binap" which has this property:

Although the molecule here is a peptide, and possesses amino acids having chiral centers, including isoleucine having two chiral centers, it also possesses the other kind of chirality. The molecule is tryptorubin A, a cyclic peptide, with non-amino acid moieties in it (that clearly can be distinguished as having been biosynthesized from amino acids. Tryptorubin A was discovered in the bacteria associated with the fungus that is in a symbiotic relationship with a species of ants.

Similar molecules, modified cyclic peptides, have proven to be important medications; vancomycin, an antibiotic that is a "antibiotic of last resort" for treating bacterial infections caused by organisms that have evolved resistance to many other antibiotics, is in this class.
Anyway, the authors of this paper have discovered interesting stereochemical properties of this molecule, tryptorubin A as a result of working on its total synthesis.
The introduction to the paper is well written, and should be accessible to some non-chemists:
For certain macromolecules, however, shape is directly tied to atomic connectivity rather than to conformational changes (Fig. 1A, left). In the case of cyclic DNA, for example, the wound and unwound topologies are interconvertible only by the scission and reformation of phosphate linkages (4). Likewise, molecular catenanes have been synthesized with defined topology (5). Such nonsuperimposable and noninterconvertible topologies are called topoisomers. Two molecules are topoisomers of each other if they have identical connectivity but nonidentical molecular graphs—that is, molecular pairs that are noninterconvertible without the breaking and reformation of chemical bonds (6).
The next parts may be less accessible to non specialists:
In contrast to both canonical (singly axially chiral) atropisomerism and topoisomerism, there exist a variety of shape-defined molecules that are theoretically interconvertible by bond rotation but are categorically distinct from canonical atropisomers because of the multiple and nonphysical bond torsions required for their interconversion. Many mechanically interlocked molecules fit into this middle ground; for example, both rotaxanes (7) and lasso peptides (8) (Fig. 1A, center) are topologically trivial and should formally be considered atropisomers with their unthreaded counterparts, but are clearly categorically distinct from simple prototypical examples of atropisomerism. [For another compelling case of noncanonical atropisomerism, see (9).] In a physical (rather than theoretical) sense, most members of the lasso peptide class of natural products can be interconverted from unthreaded to threaded shapes only by breakage and repair of the peptide backbone...
Figure 1:

It's caption:
(A) Shape-based isomerism in synthetic and natural products spans a broad range. At one end (left), defined topology encodes topoisomers. At the other end (right), canonical atropisomerism is defined by simple axial differences (i.e., torsion of a single bond). Under the broad umbrella of atropisomerism, but distinct from more canonical examples, are noncanonical atropisomers (center) that are formally topologically trivial, but whose interconversion requires complex multibond rotations and unphysical torsions. Historically, this area has been occupied only by macromolecules; in this work, we disclose a small-molecule natural product that presents this type of noncanonical atropisomerism. Structures obtained from PDB and/or CCDC database: circular DNA, reproduced from (30); lasso peptide, PDB 5TJ1 (8); catenane, CCDC #1835146 (5); rotaxane, CCDC #1576710 (7). (B) Left: Originally proposed structure of tryptorubin A. Right: Two noncanonical atropisomers are possible within the limits of the originally proposed 2D structure. Note that 3D structures of 1a and 1b are computed, not crystallographic, and their terminal residues are truncated for clarity.
The point of the paper is described here:
The authors began their synthesis with the protected version of a the dipeptide Tryptophan-3-iodotyrosine methyl ester and went through a number of (fairly low yielding) steps:

The caption:
(A) Synthetic route to atrop-tryptorubin A (1b). (B) Strategic hypothesis to use point chirality to drive an atropospecific synthesis of tryptorubin A. Piv, pivalate; PMB, para-methoxybenzyl; Ns, nosyl; DTBMP, 2,6-di-tert-butyl-4-methylpyridine; HATU, hexafluorophosphate azabenzotriazole tetramethyl uronium; PyAOP, (7-azabenzotriazol-1-yloxy)tripyrrolidino-phosphonium hexafluorophosphate; nOe, nuclear Overhauser effect.
This represented, I'm sure, a huge amount of work for graduate students and/or postdocs.
And then they discovered that this was a case, as someone - I forget who - said of the origin of advances in basic science, where the scientists said, "Hey, that's funny..."
This is a somewhat esoteric description of "Hey, that's funny..." but trust me, that's what it is:
With these contrasts in spectral data in mind, we began to consider possible explanations for the structural discrepancy between 1 and 1b. We considered the possibilities of stereochemical misassignment (e.g., a D–amino acid) or regiochemical misassignment (e.g., alternate regiochemistry in the indole-pyrroloindoline C-C bond) in the natural and/or synthetic products. After exhaustive review of natural 1 and synthetic 1b’s respective spectral data as well as a separate total synthesis of C26-epimeric species epi-8 [see (13) for this additional synthesis], we confirmed that natural 1 and synthetic 1b had the same connectivity and point-stereochemistry (13). It was only upon careful analysis of the two compounds’ ROESY spectra that a key insight was discovered: Although the natural product (1a) showed strong nuclear Overhauser effect correlations from H9 and H10 to H42 (Fig. 2B), the analogous H9 and H10 protons in the synthetic (1b) compound’s ROESY spectrum showed correlations to H40 (Fig. 2A). This key geometric constraint, combined with additional spectral evidence [1b and 1a in Fig. 2, A and B; see (13) for additional details and full skeletal numbering system], illuminated our understanding that even within the limits of identical connectivity and stereochemistry, 1 could potentially exist as two noncanonical atropisomers (“bridge above,” 1a; “bridge below,” 1b)...
... We hypothesized that by geometrically locking the cyclization precursor into the “bridge above” conformation, we could achieve inversion of atroposelectivity. Combining this hypothesis with crystallographic evidence of the geometry of indoline 7, we recognized that in a substrate such as indoline 9, the point chirality at indoline (Fig. 2B, purple methine) would geometrically preclude the “bridge below” conformer (9b); indeed, geometric limitations of 9 would render the cyclization atropospecific for the “bridge above” atropisomer 1a (resulting from cyclization of 9a). Such a strategy is reminiscent of methods to control more canonical atroposelectivity by point-to-axial chirality transfer (18).
Figure 3A describes our successful execution of the atropospecific strategy laid out in Fig. 2B and the subsequent total synthesis of the natural isomer of tryptorubin A (1a)...
Figure 3:

It's caption:
(A) Atropospecific synthesis of tryptorubin A (1a). (B) Top: A RiPP sequence that encodes tryptorubin A’s linear peptide sequence. Bottom: Proposed biosynthetic pathway to 1a. Amino acid abbreviations: A, Ala; F, Phe; H, His; I, Ile; K, Lys; L, Leu; M, Met; N, Asn; Q, Gln; R, Arg; S, Ser; W, Trp; Y, Tyr.
A graphical cartoon ("thought experiment" ) from the paper:

Top: Theoretically, interconversion would require an unphysical inside-out flipping of the molecule, in which one macrocycle passed through the other. Center: This is analogous to atropisomeric inversion of a rotaxane, which would require unphysical stretching of the ring (green) over the dumbbell. Bottom: Such noncanonical atropisomers are contrasted with prototypical atropisomers such as binaphthol, which can interconvert through simple bond torsion.
Some commentary of the synthetic biology of this interesting molecule:
...Screening the translated Streptomyces sp. CLI2509 genome sequence for the tryptorubin core peptide sequence (Ala-Trp-Tyr-Ile-Trp-Tyr) resulted in a single hit. Close inspection of the unannotated region revealed a ribosomal binding site followed by a transcriptional start site, a putative RiPP precursor gene encoding a 20–amino acid leader, a core peptide, and a stop codon downstream of the core sequence (Fig. 3B and fig. S17). This sequence is followed by a gene encoding a cytochrome P450 enzyme that is likely involved in the formation of the nonproteogenic carbon-carbon and carbon-nitrogen bridges. Although cytochrome P450 enzymes that catalyze carbon-carbon bond formation in ribosomal peptides have not been reported (24), analogous carbon-carbon linkages between the aromatic residues in the nonribosomal peptide vancomycin have been shown to be installed by cytochrome P450 enzymes (25–28)
Thus spake Vancomycin.
A concluding remark:
I don't know what the "use" of this science might be, but irrespective of its use, it is beautiful, and its wonderful to contemplate a beautiful thing on a Sunday afternoon.
I hope your Sunday afternoon is as wonderful as mine. First life is wonderful, and then you die.
We briefly set an all time new record for CO2 concentrations at Mauna Loa in January(!!) 415.79 ppm.
Because we are supremely uninterested in doing anything serious at all about climate change beyond offering silly platitudes about what so called "renewable energy" will do "by [insert some year 20 or 30 years off here]," a new all time record for carbon dioxide concentrations measured is set every year.
As I often note in this space the readings are sinusoidal, superimposed on a steadily rising slightly less than linear axis, as this graphic, which I often reproduce, from the Mauna Loa website shows:

Every year, like clockwork, a new all time record is set in May.
I check the Mauna Loa website weekly on Sundays to update my spreadsheet for weekly year-to-year increases, and this morning the data isn't up yet, so I went over to the daily readings, and to my surprise, found this:
Recent Daily Average Mauna Loa CO2 (Accessed 1/26/2020, 6:29 am)
January 24: Unavailable
January 23: Unavailable
January 22: 414.08 ppm
January 21: 415.79 ppm
January 20: 413.25 ppm
Last Updated: January 25, 2020
For weekly data, the all time records at Mauna Loa are these for the last few years:
For 2015, set in the week of May 3, 404.11 ppm
For 2016, set in the week of May 22, 408.31 ppm
For 2017, set in the week of May 14, 410.36 ppm
For 2018, set in the week of May 13, 411.85 ppm
For 2019, set in the week of May 12, 415.39 ppm
I don't record the daily data, and there may have been higher daily spikes in the past; I don't know.
Nevertheless, to the best of my recollection, I have never seen any data point as high as 415.79 which I put bold above, as recorded on January 21 of 2020.
It may be related to the Australian fires, and may represent to some extent statistical noise, but, still, this is very, very, very scary, unbelievably scary, particularly to see it in January.
If any of this troubles you, don't worry, be happy. Head over to the E&E forum to read all about some pristine wilderness being torn apart to make roads for trucks delivering huge steel towers for the latest wind farm, which will be illiterately discussed with the fraudulent unit "megawatts." This destruction of pristine wilderness areas has nothing to do with the environment, and nothing to do with climate change, but it's very popular stuff in modern advertising and makes everyone feel all warm and fuzzy, except, perhaps, me.
Have a pleasant Sunday.
Molecular tuning of CO2-to-ethylene conversion
The paper I'll discuss is this one: Molecular tuning of CO2-to-ethylene conversion. (Sargent et al, Nature volume 577, pages 509–513(2020))
In the case where carbon dioxide is reduced to make ethylene, the starting material for polyethylene and other polymers, the carbon so obtained is sequestered.
As I noted in a previous post, plastics have their own risks, huge risks in a purely environmental sense, but long term use of plastics as opposed to single use, will sequester carbon dioxide. Nothing is ever black and white.
The paper's abstract begins with the usual paean to the regrettably popular "renewable energy" Gods, although all the worship focused on them has not made them to do anything at all to address the rapidly rising use of dangerous fossil fuels, coupled intimately with the rapidly rising rate of the destruction of the planetary atmosphere. This said, one of the limitations of and reason for the failure of the so called "renewable energy" industry in addressing climate change is that it produces electricity at times that it is not needed, making the electricity generated have no value whatsoever while destroying the value of electricity produced by reliable sources, thus driving overall electricity prices up, not down. (There is a reason that Germany and Denmark have the highest consumer electricity prices in the OECD.)
Everybody loses when electricity prices go negative despite rhetoric to the contrary.
To address fluctuations in demand, however, most power grids maintain generation that is not utilized and not sold: This is termed "spinning reserve" and is designed to address demand surges. In a sensible world, as opposed to the world in which we actually live, "spinning reserve" might actually be utilized for production purposes with a capability to be rapidly switched to a grid when needed. This would tend to reduce electricity prices, since it would allow for the utilization of continuous reliable baseload power systems such as those produced by nuclear energy, which is measurably the most reliable system of electricity production in the world and also the cleanest, to produce value at all times.
Thus this paper is interesting.
From the text:
These pyridinium type systems build on the work of Emily Cole and Andrew Bocarsly at Princeton University from some years ago. (Dr. Cole's company built on this technology failed however.) Their work is referenced in this paper. I'm glad to see this. I met Dr. Cole once, and I liked her very much.
Here are the structures of the pyridinium systems utilized in the paper:
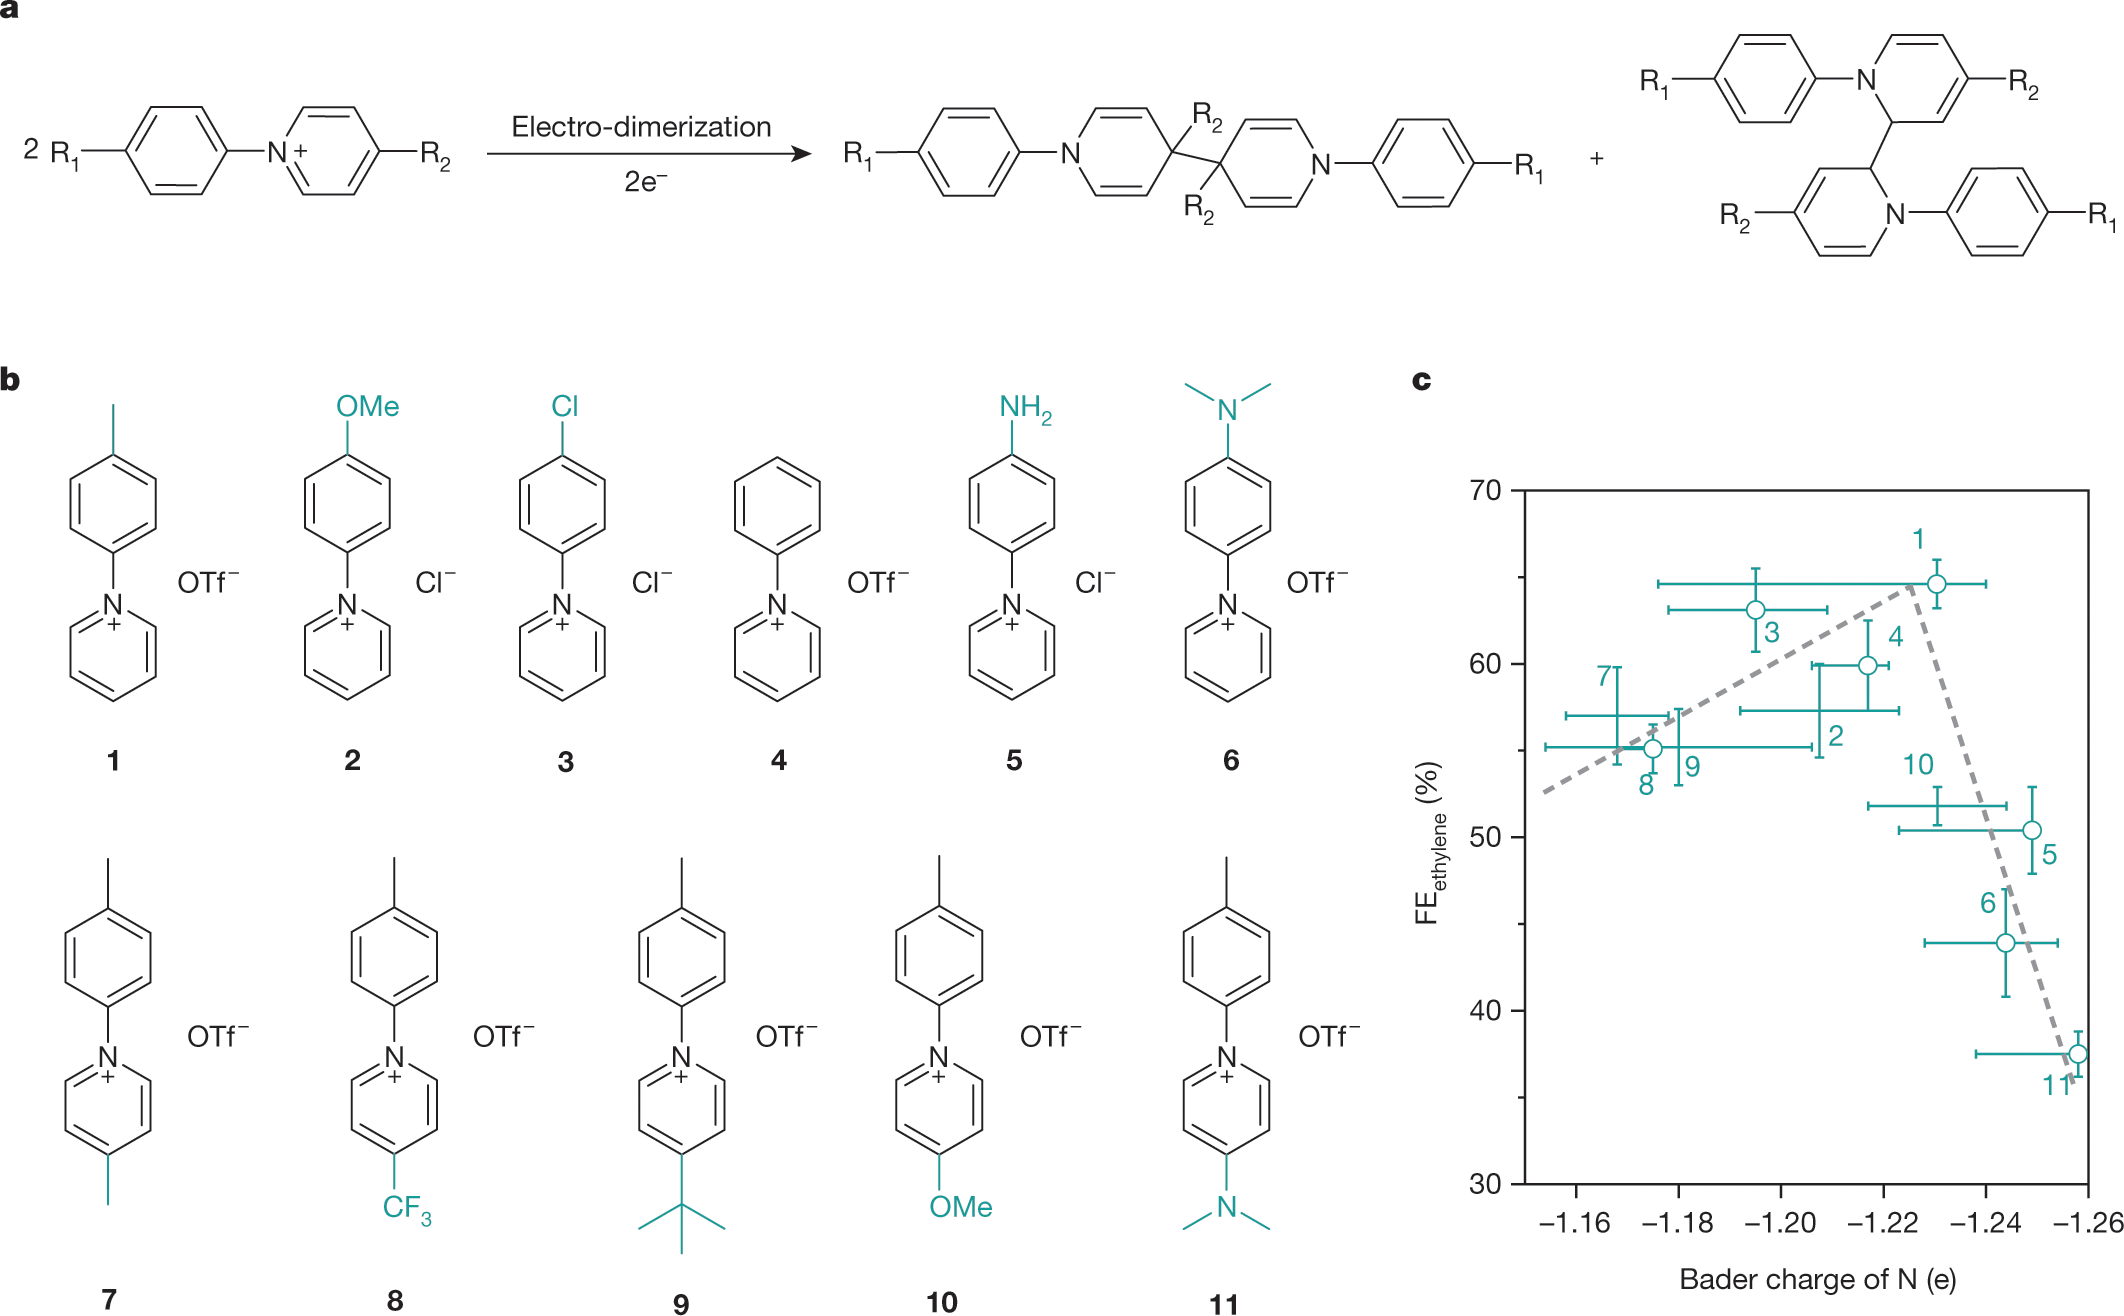
The caption:
The authors continue:
We evaluated CO2RR properties of these tetrahydro-bipyridine-functionalized electrodes in a liquid-electrolyte flow cell system (Supplementary Fig. 11), using CO2-saturated 1 M aqueous KHCO3 as the supporting electrolyte. In this system, the abundant catalyst/electrolyte/CO2 triple-phase interfaces overcome the CO2 mass-transport limit17,18 and thus enable commercially relevant current densities19,20. We note that, although the large achievable current densities in the flow cell drive up local pH (Supplementary Fig. 12), the tetrahydro-bipyridine layer does not create a further pH gradient near the active Cu surface (Supplementary Note 2).
The authors synthesized a chemical library of pyridinium salts to test, a good idea. Chemical libraries have come a long way since the early days, days in which I personally had occasion to work on them.
A few more graphics:
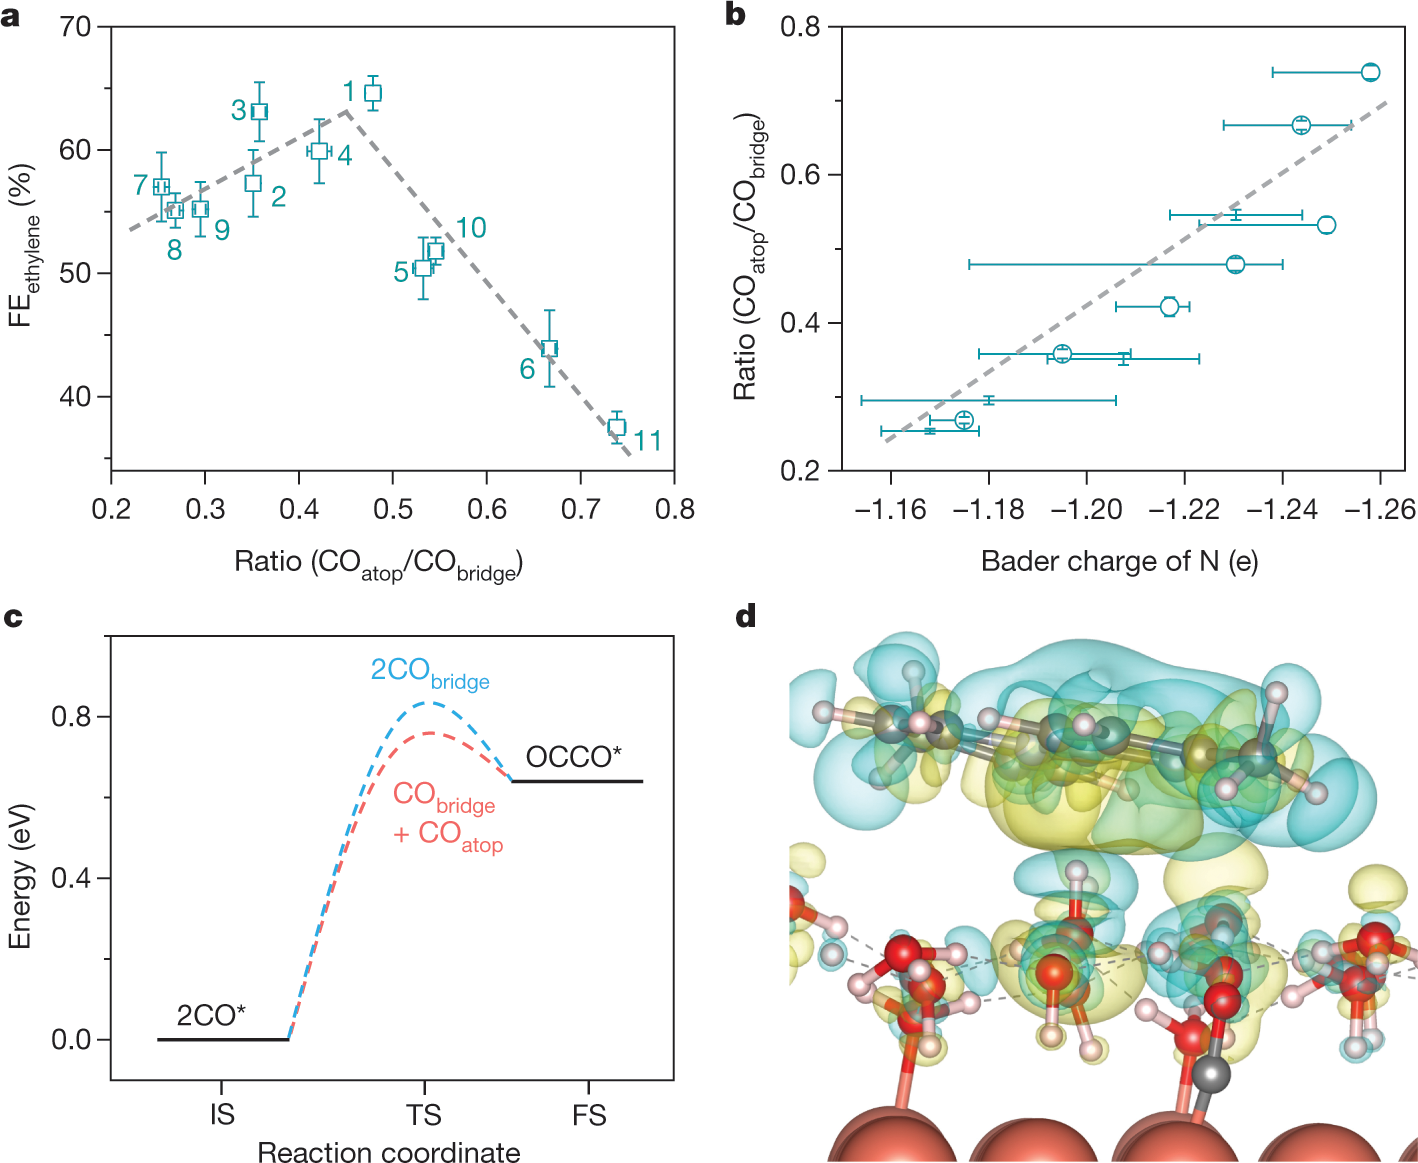
The caption:
The caption:
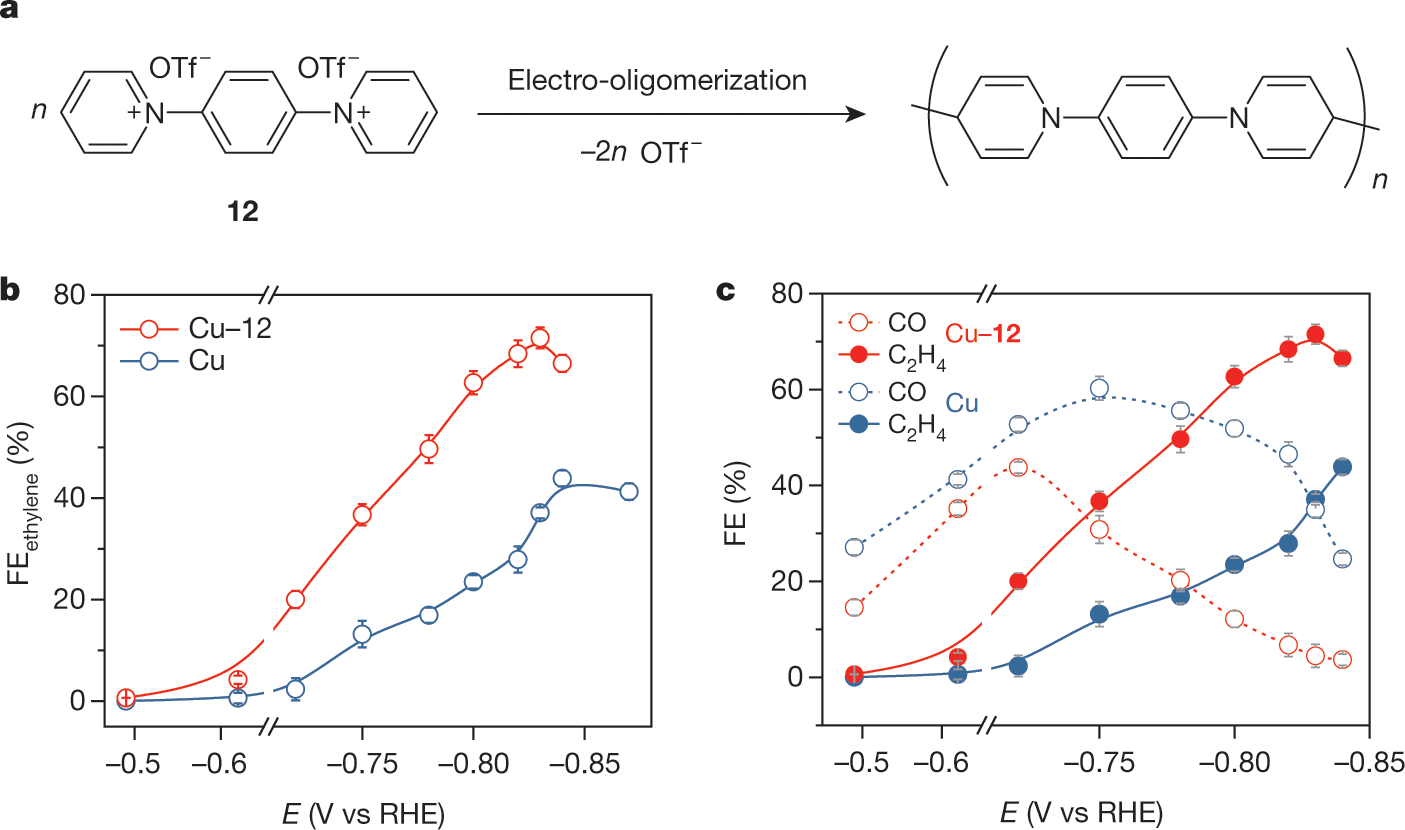
 1,4-phenylene)bispyridinium salt 12 to form an N-aryl-dihydropyridine-based oligomer. b, FE of ethylene on Cu and Cu–12 using CO2-saturated 1 M KHCO3 as the supporting electrolyte. c, FEs of CO and ethylene on Cu and Cu–12 at the applied potential range of ?0.47 V to ?0.84 V. The error bars for FE uncertainty represent one standard deviation based on three independent samples.
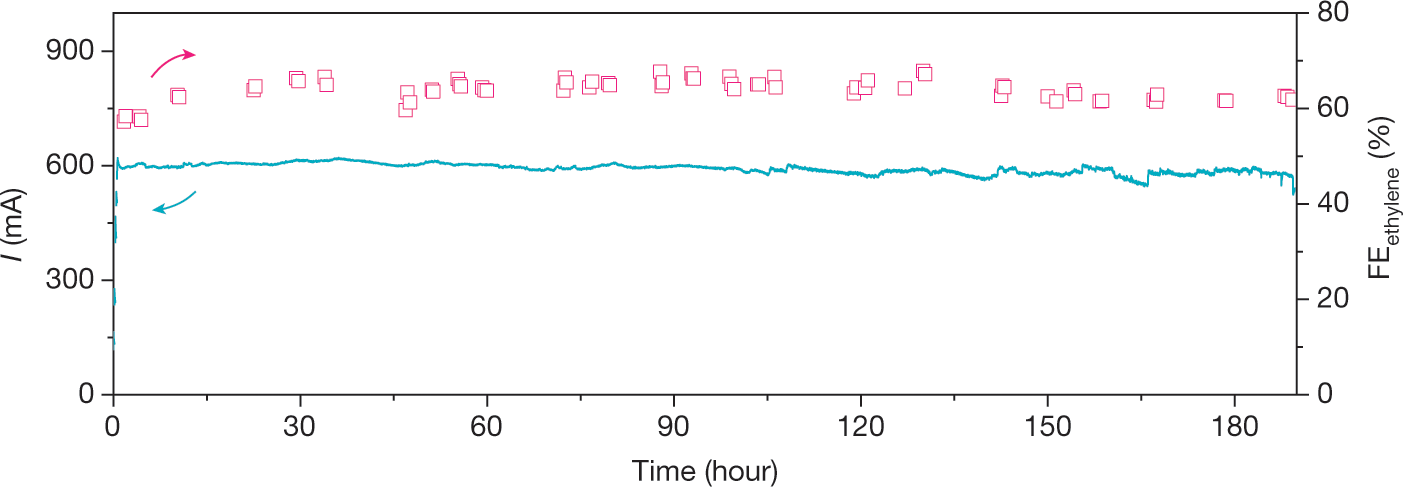
The caption:
The authors conclusion:
Cool if it works, although as energy storage, it is not particularly efficient, even less efficient than all those tons of batteries on which people want to foolishly bet the future of the planet.
I hope you're having a nice Saturday afternoon.
Report on the Abundance of Floating Plastic Particles in the North Atlantic Ocean.
The paper I'll discuss in this post is this one: Abundance of Floating Plastic Particles Is Increasing in the Western North Atlantic Ocean (Chris Wilcox*Britta Denise Hardesty*Kara Lavender Law, Environ. Sci. Technol. 2020, 54, 2, 790-796)
I recently had an outbreak of bravery and, albeit with some trepidation, ventured into the General Discussion forum here in a thread where a member of my generation, the so called "Baby Boomers," was trashing our most recent generation of adults, the "Millennial" generation, for not being more "activist." In a wonderful exchange there, which included the point that my generation's modern "activism" seems to consist of being the most reliable demographic for supporting the orange criminal in the White House, we have also been the most piggish generation of all, listing all the things we destroyed in our tenure of dominating the world, for example, the planetary atmosphere, the land, and the oceans, well, um, everything. As an example I referred to plastic pollution, placing a photograph of the Woodstock Rock Festival's garbage along side the garbage washed up recently on an uninhabited Hawaiian beach.
I noted that the world would be much improved if a large set of us baby boomers would just shut up and die. (People who find me unpleasant should feel free to offer advice along these lines.)
Anyway, about those of us of the "Woodstock Generation" ersatz peace and love and all that stuff:
We are not star dust, we are not golden, but we are carbon, too much of it.
The destruction of the ocean by my generation has very much involved the inventory of dumped plastic. Not so long ago I discussed and posted a link to a paper in this space about the distribution of surface, intermediate, and seafloor plastic in Hawaii.
That post is here: Distribution & Type of Marine Debris Polymers on Hawaiian Island Beaches, Sea Surface, and Seafloor.
Writing that post reminded of a basic fact that more or less slipped out of my mind, which is that many polymers are well known and widely used that are heavier than seawater and thus sink.
A table from that post is reproduced here for convenience:

This brings out an important point. Plastic pollution is not limited to floating plastics. Many important plastics sink.
Regrettably, the Pacific Ocean is not the only ocean being destroyed with plastic. The Atlantic is right up there, as the paper under discussion shows. From the introduction:
 3) where is all the plastic? Similarly, no temporal trend in surface plastic abundance could be detected in a 22 year data set (1986–2008) from the subtropical gyre of the western North Atlantic Ocean, where floating plastics accumulate,(4) or in an expanded analysis to 2012.(5) The lack of increased floating plastic particle abundance over time is puzzling since global plastics production increased by 562% between 1976 and 2014,(6) similar to the increase in the amount of plastics discarded in the United States municipal waste stream.(7) Moreover, the rate of plastic production is accelerating, with a doubling time in the order of 11 years,(6) implying that changes should be easier to detect with the passage of time. In addition, two recent global modeling analyses of ingestion rates by marine species have detected increases in ingestion rates over time,(8,9) although a regional long-term monitoring study of a single seabird species did not.(5)
It could be that plastics are removed from the sea surface at a rate that compensates for the increased input. Floating plastic particles may be removed by ingestion by marine organisms, buoyancy decrease and sinking, coastal deposition, or fragmentation to sizes smaller than the plankton nets typically used to collect them.(4) Evidence from a variety of laboratory and field studies supports the occurrence of each of these removal mechanisms,(10,11) but the removal rate in the ocean has not been satisfactorily quantified for any of these potential mechanisms. Unless removal rates collectively equal or exceed the input rate, one would expect to measure an increase in the abundance of floating plastics over time in the subtropical ocean gyres, where floating debris accumulates.
A second possible explanation for the lack of observed increase in abundance in time is the difficulty in separating the confounding effects of spatial and temporal variation in the observations. Previous studies have described large spatiotemporal variability in the amount of floating plastic debris collected using surface plankton nets,(12,13) even in the subtropical ocean gyres. Surface winds cause vertical mixing of particles(14,15) and appear to have other nonlinear effects on surface concentration with increasing wind speed.(16,17) Variability due to wind mixing, small-scale circulation features, variable input or removal, and other factors is difficult to quantify because evaluations of temporal trends to date have not been made using data sets from longitudinal studies at fixed locations. This implies that spatial variation in sampling over time will add further variance into the observations, making a time trend more difficult to detect.(11)
The goal of this work was to evaluate whether there is evidence of a time trend in floating surface plastic particles in the western Atlantic Ocean.
Plastic in the Altlantic ocean is decreasing or steady state? Let's see.
The paper offers some concentration data in graphic form:

The caption:
Of course, what you measure depends on how you measure it and when you measure it, and how often you measure it, a topic on which the author's discussion and graphic touches.
Figure 2 from the paper:

The caption:
The quality of the measurement made at any time is actually subject to external trends that may not reflect the overall concentration averaged over time, but rather local conditions at the sampling time. For example, high winds may push plastic away or into a region if said winds are blowing at the time of sampling.
The authors thus write:
This graphic, which is based on some computational parameters, is not about plastic concentrations but rather about the nature of the measurements:

The caption:
The next graphic is about trends in the accumulations of plastic.

The caption:
From the author's discussion:
Furthermore, the relationship observed suggests that plastic concentration is accelerating compared to cumulative production. We hypothesize that this acceleration may result from particle fragmentation. Global plastics production is reported as mass (tons), whereas plastic particles are reported as a numerical concentration (number of particles per unit area). Most particles collected in plankton nets are ?0.35–10 mm in size and, based upon their size and shape, likely originated from fragmentation of larger objects,(19) which is known to occur when plastics undergo photodegradation and weaken upon exposure to sunlight and other physical processes.
To test the plausibility of this hypothesis, we built a hypothetical fragmentation model(18) (see detail provided in Figure S2), which indicates that, if the time to fragment from a large item (100 g) to smaller particles (0.00001 g) is sufficiently long, and particle removal is minimal, then the total number of particles will accelerate with respect to cumulative production. Furthermore, the model suggests that, if particles are lost from the system at any appreciable rate relative to inputs, either through flux away from the sea surface or by fragmentation to smaller sizes that can be captured by the plankton net, then the relationship between particle count and cumulative production will decelerate, rather than accelerate as observed.
We detected substantial variability associated with all sampling conditions tested: wind speed measured during the tow, tow length, and time of day. The inverse relationship between wind speed and measured surface concentration of microplastics is consistent with studies modeling the turbulent wind-driven mixing that submerges even buoyant materials below the sea surface where the measurements are made.(14,16) The mechanism driving the inverse relationship between tow length and measured surface concentration is unknown. We do, however, posit three hypotheses to explain the pattern. First, the efficiency of water passage through the net might be reduced on longer tows due to larger amounts of biological material accumulating in the net, which could cause a pressure wave at the mouth of the net that diverts seawater and suspended material around the net. A second related possibility is that larger volumes of material resulting from longer tows make visual sorting of the material for microplastics more difficult. Finally, surface concentrations of plankton and other floating materials typically exhibit patchiness or regions of high concentration separated by larger regions of very low concentration. A longer tow would be more likely to sample the larger areas of plastic-free water in between these patches, a hypothesis supported by the fact that the modal value in the data set is zero (35% of values). Finally, there are two potential explanations for the daytime bias in plastic particle concentration. Plankton net samples are typically collected twice per day, at noon and midnight local time, and samples are analyzed onboard the ship within 1–2 h of collection. It is possible that visual selection accuracy is reduced in midnight tows because of analyst fatigue and/or insufficient lighting conditions in the ship’s laboratory. An alternative explanation is physical in nature. There is evidence of a diurnal cycle in vertical mixing at the sea surface due to the diurnal daytime heating (nighttime cooling) cycle, which causes reduced (enhanced) turbulent mixing that submerges surface microplastics.(14)
It would seem to me, based on some recent experience in the lab, that the issue of "analyst fatigue" can be automated away. For roughly $10,000 plus or minus a few thousand, one can buy microscopes that are quite good at particle determinations, although plankton would be an obvious limitation on such an approach. There are also quite reliable particle size devices, which, albeit at higher expense count particles quite well. By comparing particle numbers with the optical density at several wavelengths to subtract out known plankton associated spectral lines, assuming that there is no interference one might be able to differentiate plastic from plankton, even if fish and crustaceans cannot do the same.
Of course, it is also possible that I don't know what I'm talking about in this case.
Irrespective of how one counts though, your seafood, if you eat seafood, contains plastic and the amount of plastic it contains will continue to rise.
The section of the paper called "Implications" has some good news with a huge caveat, which is that the estimates the authors made are an order of magnitude lower than other estimates about the rate of accumulation of plastic in the seawater.
Based on our model, we estimate that, in 2010, the surface plastic concentration in the western North Atlantic increased by 0.1 particle/m2 for every ton of plastic produced globally. Using an average particle weight of 0.014 g(4) and a global ocean area of 361.9 million km2, this yields an increase of 506,000 tons of plastic in the ocean in 2010 or 0.2% of global production.(6) This is an order of magnitude lower than Jambeck et al.’s estimate that between 2% and 5% of global plastic production, by weight, entered the ocean in 2010.(2) The two estimates are not directly comparable since only buoyant plastics in a narrow size range are accounted for in the ocean data presented here. Furthermore, trends in other ocean basins may differ from our North Atlantic estimate because of differences in input rate (i.e., the largest sources of land-based waste are predicted to be Asian countries into the Indian and Pacific Oceans(2)) and transit times. However, this is a substantially better match than previous comparisons between estimated input and observed surface plastic concentrations in the open ocean.(1,17)
Plastics, of course, are sequestered carbon, and, if in some nuclear powered future they were made from carbon dioxide ultimately obtained from the air rather than from dangerous petroleum, they might help to mitigate climate change. This said, it is not acceptable for them to end up in our rivers, our lakes, our seas and, for that matter in our land. We need to close the plastic waste cycle completely. (The use of high temperatures in the absence of air can do this.)
In my studies over the years, I have come to feel that extraction of carbon dioxide from seawater may be the only feasible way to accomplish the task. One route to doing this involves raising seawater to supercritical temperatures, a topic to which I've alluded previously in this space. Under these circumstances, the plastic in seawater would be oxidized, although, were it to find its way back into the air, it would represent further destruction to the atmosphere, since it would liberate plastics obtained from dangerous fossil fuels, primarily petroleum, although some polymers are made using dangerous coal and dangerous natural gas.
I trust you're having a wonderful weekend.
Absorption of Water Molecules on a TiO2 Surface and the Water Gas Rxn Have Been Visualized.
The paper I'll discuss in this post is this one: Visualizing H2O molecules reacting at TiO2 active sites with transmission electron microscopy (Wentao Yuan1,*, Beien Zhu2,3,*, Xiao-Yan Li2,4,*, Thomas W. Hansen5, Yang Ou1, Ke Fang1, Hangsheng Yang1, Ze Zhang1,†, Jakob B. Wagner5,†, Yi Gao2,3,†, Yong Wang1,† Science 2020:
Vol. 367, Issue 6476, pp. 428-430)
The key to reversing the climate change now underway at an accelerating rate is almost certainly thermochemical carbon dioxide splitting into carbon monoxide and oxygen, using transition metal oxides or cerium oxide and nuclear heat
. Effectively access to carbon monoxide is equivalent to access to hydrogen using the water gas reaction CO + H2O <-> H2O + CO2. The overwhelming majority of the hydrogen produced industrially on this planet (>98%) for captive use (the only safe and appropriate use) is produced using this reaction, the CO being produced from the partial oxidation of dangerous natural gas.
From my perspective, a key material to make a sustainable future is the relatively common element titanium, in both its metallic form - which is now accessible at reduced costs using the FFC Cambridge process - and its oxide, which turns out to be a very valuable catalyst for splitting water using CO. (It can also photochemically split water, but decades of research have failed to make this process anywhere near being capable of industrialization.)
This paper, out of China, does something quite remarkable, which is to obtain images of water molecules on the surface of titanium oxide.
From the text:
The atomic structure of the TiO2 (1×4)-(001) surface has been characterized by both aberration-corrected ETEM and scanning transmission electron microscopy (STEM) images. The bulk-truncated (1×1)-(001) surface usually reconstructs to a (1×4)-(001) surface (Fig. 1, A to C) by periodically replacing the surface oxygen rows (along the [010] direction) with TiO3 ridges every four unit cells along the TiO2[100] direction (15–17). As a result, protruded Ti4c rows are periodically exposed on the surface and show distinct contrast, so the subtle changes occurring in reactions could be detected by means of ETEM observation without contrast overlap. The ordered Ti4c active rows could provide sufficient contrast for direct ETEM visualization of water if the molecules adsorbed in ordered arrays...
Figure 1:

The caption:
(A) High-angle annual dark-field–STEM image of the (1×4)-(001) surface, viewed from the [010] direction. The image was acquired at 700°C in vacuum (TEM column pressure: ~10?7 mbar). (B) ADM reconstruction models of the (1×4)-(001) surface (Ti, gray; O, red). (C) Atomic models of a Ti4c row. (D to G) Aberration-corrected in situ ETEM images show the same area of TiO2(001) surface at 700°C under oxygen [(D), 0.001 mbar] and water vapor [(E), 0.01 mbar; (F), 1 mbar; (G), 2.5 mbar] conditions. Scale bar, 1 nm. (H to J) Another case shows the reversible structural transition induced by a change in the gas environment at 700°C from oxygen [(H), 0.001 mbar] to water vapor [(I), 3 mbar] and then reversion to oxygen [(J), 0.001 mbar]. Scale bar, 2 nm.
The authors restructured the common mineral form of TiO2 (rutile) by heating it in oxygen, evacuating the oxygen, and then exposing the reconstructed mineral to steam.
The O2 gas was then evacuated, and H2O vapor (fig. S1) was introduced at the same temperature. When the H2O pressure was raised to 1 mbar, two additional small protrusions were observed at the top of the Ti4c rows (Fig. 1F). This twin-protrusion structure became more resolved for a H2O pressure of 2.5 mbar, owing to a higher water surface coverage (Fig. 1G and movie S1)...
Figure 2 of the paper:

The caption:
(A) In situ FTIR spectra of the hydroxyl region for TiO2 in the presence of water vapor (5 mbar; 500°C) and vacuum (10?6 mbar; 500°C). The inset shows results of a theoretical simulation. (B to D) Atomic structure of the adsorbed H2O species on the TiO3 rows, as verified by theoretical calculations, viewed from the [010] direction (B), the [100] direction (C), and the [00-1] direction (D) (gray, Ti; red, O; cyan, H).
Visualizing the water gas reaction:
Figure 3:

The caption:
(A) Sequential ETEM images acquired in the mixed gas environment (1:1 ratio of CO and H2O vapor; gas pressure: 5 mbar; temperature: 700°C), viewed from the [010] direction. Scale bar, 2 nm. (B) Enlarged ETEM images show the dynamic structural evolution of the Ti row outlined by the dotted rectangle in (A). Scale bar, 0.5 nm. (C) Intensity profiles along the lines crossed the Ti rows of (B). Blue arrows denote intensity valleys corresponding to the twin protrusions. a.u., arbitrary units.
My son has been working quite a bit with stuff on the atomic scale, both in imaging. (This summer he had a chance to work around neutron scattering experiments.) I'll have to share this cool paper with him.
Have a nice weekend.
China's dams isolate Asian Elephants.
The short news item from the current issue of Science, a publication of the AAAS that I'll discuss very briefly, since it speaks for itself is this one: China's dams isolate Asian elephants (Zhihong Wang, Zhengling Li, Yongjing Tang, Chongxue Yao, Yu Liu, Guilian Jiang, Fang Wang, Liang Liang, Wenlan Zhao, Gaofan Zhu, Mingyong Chen*, Science Vol. 367, Issue 6476, pp. 373-374, 2020)
The excerpt:
The Mekong upstream district (named Lancang River in China) (3), a major Asian elephant habitat (4), is also abundant in water resources and well suited to the construction of hydropower stations (5). Accordingly, China began construction on the Jinghong Hydropower Station in 2003 as part of a renewable energy plan (6). The environmental impact assessment of the project did not comprehensively describe how it would affect Asian elephants, and the station went into operation in 2008 on schedule (7).
Landscape connectivity among habitats and protected areas is crucial for conservation of wildlife, especially endangered flagship species such as Asian elephants, which require a large home range covering a variety of ecosystems (8). After the Jinghong Hydropower Station dam was completed, water levels rose and widened, making the mud banks more wet and slippery on both sides (7). Although Asian elephants could get down the banks to the river and swim across, their flat soles prevented them from climbing back out (9), stranding them in the water. As a result, no elephants have crossed the Mekong in the past decade, and movement routes and gene flow of Asian elephants living on either side of the Mekong have been blocked by the reservoir (7).
Hydroelectricity is the most successful of all forms of so called "renewable energy." Despite all the hoopla about the solar and wind industry which has failed to even make a dent in climate change, wind and solar, after 50 years of wild cheering for them, did not produce in 2018 as much energy as hydroelectric dams. Hydroelectric dams produced 15.11 exajoules of energy in 2018, all the wind, solar, geothermal and tidal systems on the entire planet, combined produced 12.27 exajoules of energy in 2018, this on a planet where human energy demand was 599.34 exajoules.
Here is a table I prepared on energy sources in the world in this century:

Source: 2019 Edition of the World Energy Outlook Table 1.1 Page 38] (I have converted MTOE in the original table to the SI unit exajoules in this text.)
The destruction of prime habitat for Asian elephants to obtain so called "renewable energy" belies the idea that such land and mass intensive energy is "sustainable."
The energy we get from hydroelectric dams is trivial. It's expansion, at the expense of destroying most of the world's major rivers has done nothing to address the rapid growth in the use of dangerous fossil fuels.
So called is not sustainable, not at least for the dwindling habitats and land areas that remain. Once destroyed, these resources cannot be recovered. Turning all of our wild areas into industrial parks for wind turbines, solar farms, and reservoirs is not a good idea. It is, in fact, a crime against the future.
Have a nice weekend.
Importance and vulnerability of the world's water towers.
The paper I'll discuss in this post is this one: Importance and vulnerability of the world’s water towers (W.W. Immerzeel et al Nature volume 577, pages 364–369 (2020).
One of the greatest risks of climate change, beyond rising seas and extreme weather, both of which are well known, is the risk to humanity's water supplies. In a lecture I attended last year, I learned that about 10% of the observed sea level rise at this point, actually involves the pumping of fossil groundwater - for example on the Ogalalla acquifer in the American midwest - which ultimately ends up in the seas. We are all familiar with the issue of arctic ice melts, but perhaps less familiar with the consequences of mountain ice melts. Here, as the authors note in the introduction, the term "Water Tower" refers to mountain range glaciation which provides fresh water for a large proportion of the world's population. From the paper's introduction:
The authors have also defined WTI, the "Water Table Index" in the abstract, which is open sourced, but for convenience I'll repeat it here:
The news, of course, is not good:
In the economic impact, the paper does not mention hydroelectricity, which trails only biomass combustion - which is responsible for about half of the world's 6 to 7 million air pollution deaths per year - as the world's largest form of so called "renewable energy."
The threat to these two forms of so called "renewable energy" should raise a question in one's mind about how sensitive this stuff is to um, weather, weather that is strongly affected by the failure of this popular madness to be effective at addressing climate change. (There is a reason that humanity stopped depending on the weather for energy, beginning in the 19th century, not that reactionaries ever look at the historic results of their evocations. Santayana and all that.)
Anyway, some graphics from the paper:

The caption:
The authors note that the effects of the destruction of mountain glaciers may also impact the frequency of natural disasters; it's not all about hurricanes and fires:
Well, none of that is likely to be a serious as Fukushima. How many people died from radiation at Fukushima again? I ask people all the time when they mention this event to me, and I never get a straight answer, if in fact, I get an answer at all. I happen to know that about 15,000-20,000 people from the part of that event that no one gives a rat's ass about - the tsunami - were killed by seawater but somehow the only area of concern is escaped radioactive materials.
The authors, in seeking to quantify effects define something called a "supply index" (SI):
...and then a "Demand Index," (DI):
This graphic touches on these indexes:

The caption:
There is a discussion of the risks to humanity, not that humanity is as important as the stock prices of the Tesla car company, with a focus on the vulnerable Indus valley:
We assess the vulnerability of each WTU and show this for the five most important (that is, with highest WTI values) WTUs in Asia and Oceania, Europe, North America and South America (Fig. 3, Supplementary Table 2). For this analysis, we include the hydro-political tension37, baseline water stress38, government effectiveness39, projected climate change40, projected change in GDP41, and projected population change9 (see Methods). The highest-ranking WTUs of South America and Asia in particular are more vulnerable than those in North America and Europe. Strikingly, the Indus, which is globally the most important water tower (Fig. 4), is also very vulnerable. The Indus is a transboundary basin with considerable hydro-political tension between its riparian countries Pakistan, India, China and Afghanistan. The population of approximately 235 million people in the basin in 2016 is projected to increase by 50% by 2050, and the basin’s GDP is projected to encounter a nearly eightfold increase41. The average annual temperature in the Indus WTU is projected to increase by 1.9?°C between 2000 and 2050, compared to 1.8?°C in the downstream section40. The average annual precipitation in the Indus WTU is projected to increase by 0.2%, compared to 1.4% downstream40. It is evident that, owing to the expected strong growth in population and economic development, the demand for fresh water will rise exponentially42. Combined with increased climate change pressure on the Indus headwaters, an already high baseline water stress and limited government effectiveness, it is uncertain whether the basin can fulfil its water tower role within its environmental boundaries. It is unlikely that the Indus WTU can sustain this pressure.
The next graphic attempts to evoke a feel the types of risks:

The caption:
And then a graphic cartoon focuses on the Indus:

The caption:
But of course, the Indus is not the only area to be affected:
The 34 authors of the paper sign off on this wishful thinking statement:
Don't worry. Be happy. Forget all that stuff. It doesn't involve you. Be happy. Someday maybe you can fly off to Mars on Elon Musk's rocket ship.
Have a nice Sunday evening.
JFK's grandson slams Pence's interpretation of 'Profiles in Courage'
I don't know if this has been posted before.
JFK's grandson slams Pence's interpretation of 'Profiles in Courage'
In a Wall Street Journal op-ed published Thursday, Pence urged Senate Democrats to break ranks and oppose the articles of impeachment brought against President Donald Trump.
Pence cited Kennedy's 1957 Pulitzer Prize-winning book, "Profiles in Courage," which has a chapter dedicated to Republican Sen. Edmund Ross of Kansas. Pence praises Ross, who broke with his party and is generally considered to have cast the deciding vote to acquit President Andrew Johnson after Johnson became the first American president to be impeached in 1868.
Pence wrote in the op-ed, "The question naturally arises: Who, among the Senate Democrats, will stand up to the passions of their party this time? Who will stand up against 'legislative mob rule' and for the rule of law? Who will be the 2020 Profile in Courage?"
Jack Schlossberg
✔
@JBKSchlossberg
.@VP Mike Pence’s recent piece in the @WSJ, “A Partisan Impeachment, a Profile in Courage,” is a total perversion of JFK's legacy and the meaning of courage. As Kennedy's grandson, and a member of the Profiles in Courage Award Committee, I took special interest. THREAD ?
18.6K
12:23 PM - Jan 18, 2020
Twitter Ads info and privacy
5,829 people are talking about this
In a series of tweets, Schlossberg wrote that Pence "is right to celebrate Ross, a public servant who, foreseeing his own defeated (sic), nonetheless summoned the courage to vote his conscience, and put the national interest above his own. But let's not be confused."
Trump "was impeached because he did the exact opposite -- he put his own interests ahead of our country's national security and, in the process, broke federal law," he wrote..
The rest is at the link.
Profile Information
Gender: MaleCurrent location: New Jersey
Member since: 2002
Number of posts: 33,512