Welcome to DU! The truly grassroots left-of-center political community where regular people, not algorithms, drive the discussions and set the standards. Join the community: Create a free account Support DU (and get rid of ads!): Become a Star Member Latest Breaking News General Discussion The DU Lounge All Forums Issue Forums Culture Forums Alliance Forums Region Forums Support Forums Help & Search
pscot

(21,024 posts)
Fri Apr 19, 2013, 07:01 PM Apr 2013

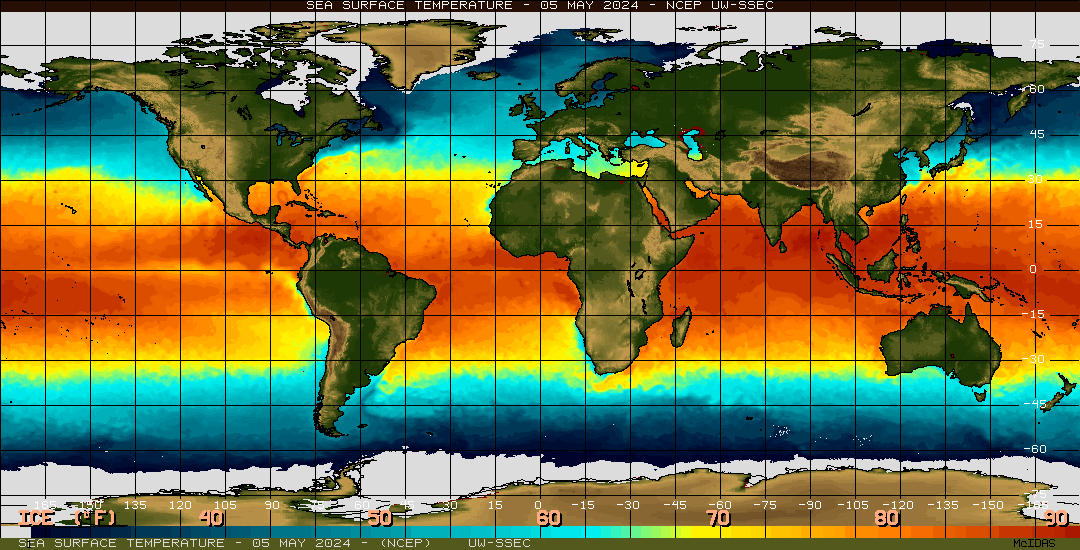
Interesting graphic of ocean heat

The dark blue reperesents unusually cold sea surface temps. Cold water is flooding the seas around Antarctica as summer ends at the South Pole.


Sea surface temperature in the equatorial Pacific Ocean (above). El Niño is characterized by unusually warm temperatures and La Niña by unusually cool temperatures in the equatorial Pacific. Anomalies (below) represent deviations from normal temperature values, with unusually warm temperatures shown in red and unusually cold anomalies shown in blue.

1 replies = new reply since forum marked as read
Highlight: NoneDon't highlight anything 5 newestHighlight 5 most recent replies
Interesting graphic of ocean heat (Original Post) pscot Apr 2013 OP
I only see the first image - basic temperature muriel_volestrangler Apr 2013 #1
Latest Discussions»Issue Forums»Environment & Energy»Interesting graphic of oc...